Explore Population Dataset and Identify Key Insights

Business Scenario

Welcome!
You have recently joined as a Junior Data Analyst at our HR analytics company.
Your company collects data from multiple regions across different cities.
Today, your manager has assigned you the task of exploring Power BI as a tool for business visualizations
Using Microsoft Power BI, you should be able to:
- Clean and standardize raw datasets
- Validate and organize data records
- Analyze workforce and demographic trends
- Build interactive dashboards and reports
- Generate accurate and decision-ready insights
Your task is to explore Power BI to create structured reports for business analysis
Pre-Lab Preparation
Topic : Explore Population Dataset & Identify Key Insights
1) Introduction to Business Intelligence
2) Self Service Business Intelligence
3) ETL vs ELT
4) SSBI Tools
5) What is Power BI?
Task 1: Installation of Power BI tool from official website
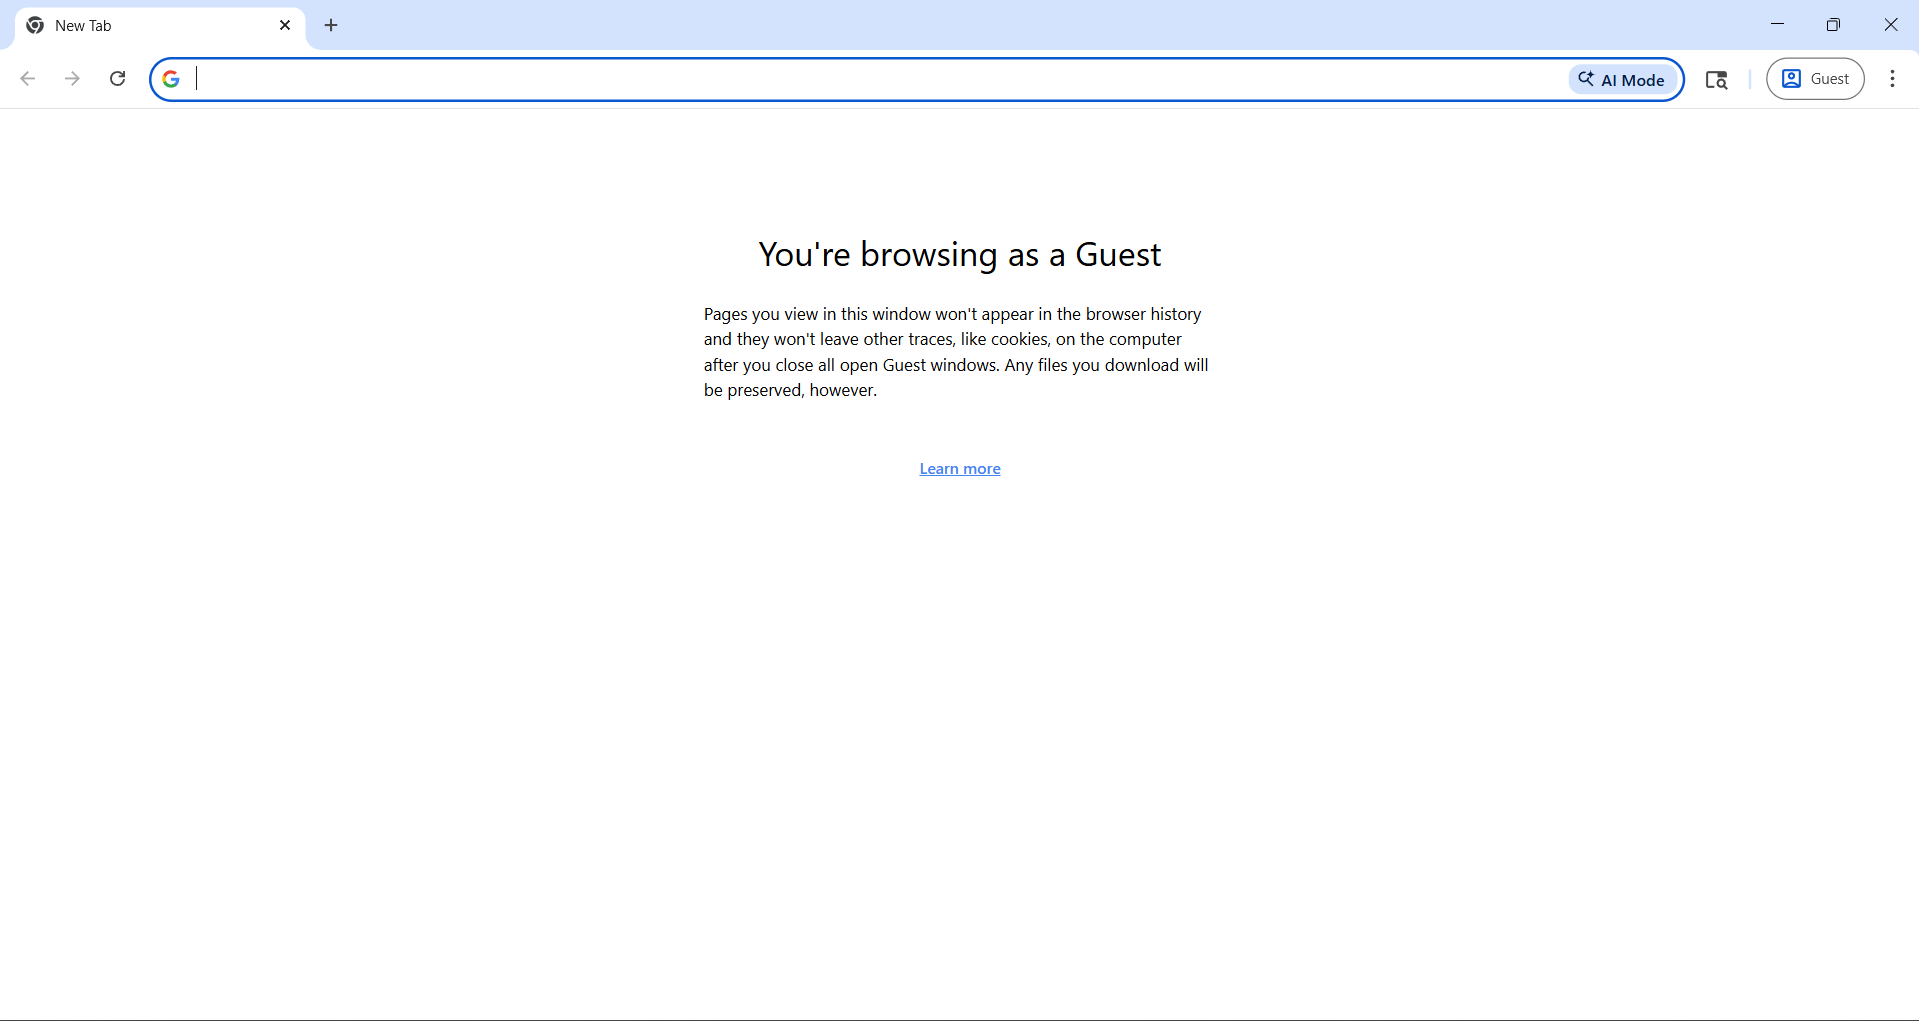
1
Open any browser, Chrome browser is recommended
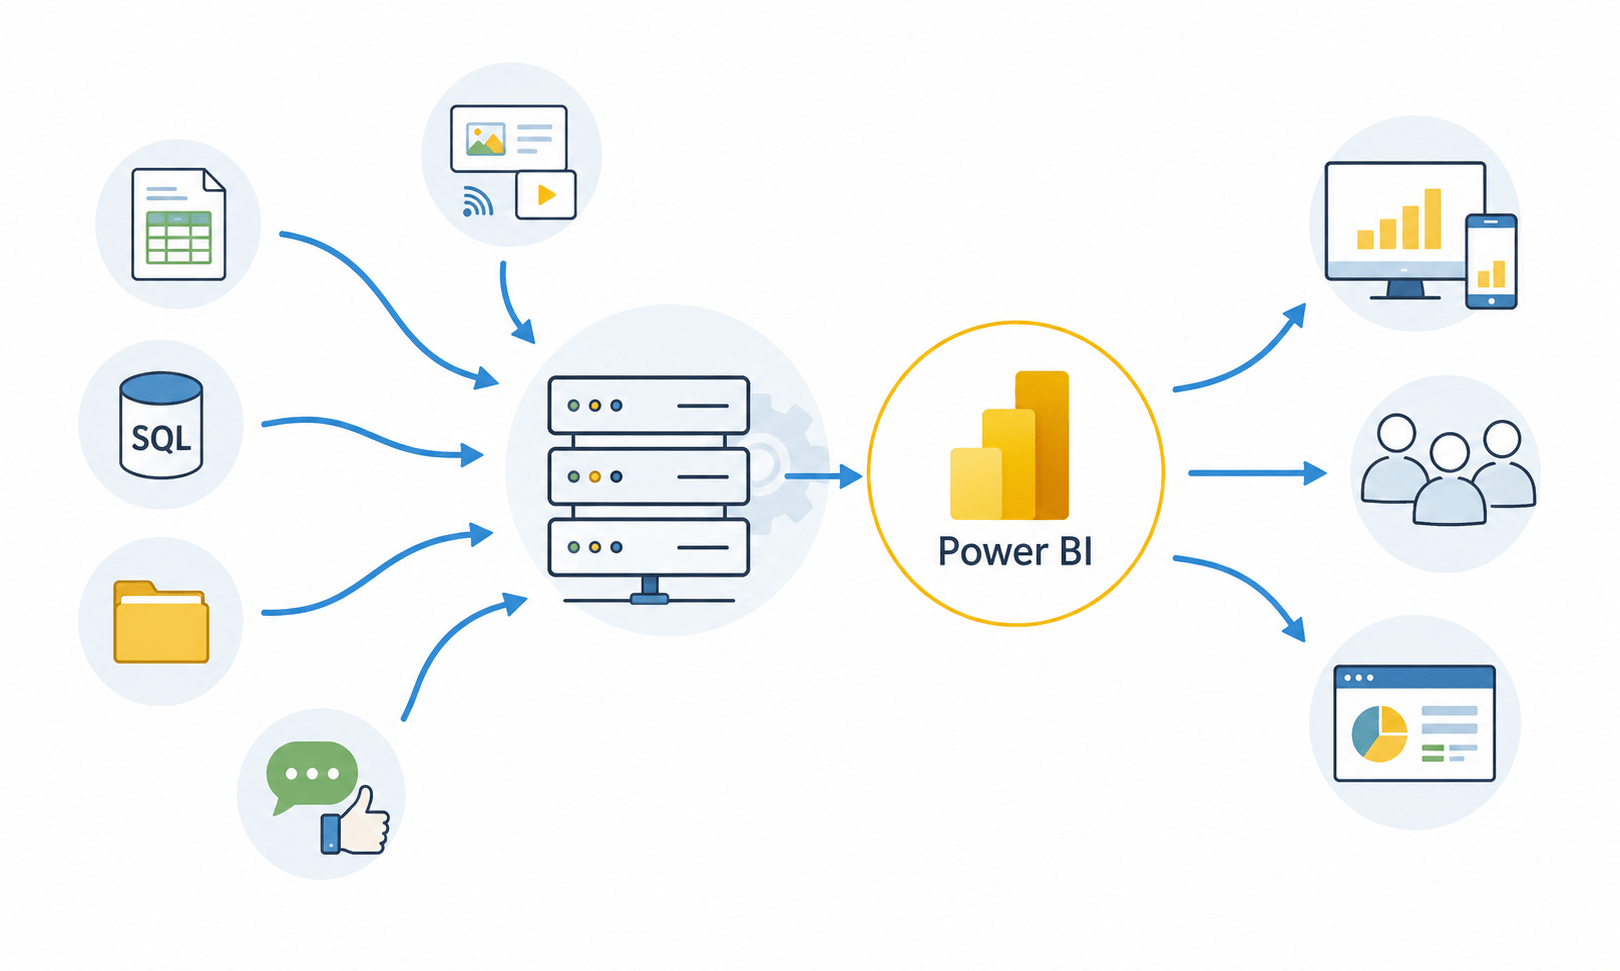
6) Key Benefits of Power BI
7) Architecture of Power BI
8) Building Blocks of Power BI
2
Use this URL inside browser URL section
Download Link : https://www.microsoft.com/en-us/download/details.aspx?id=58494
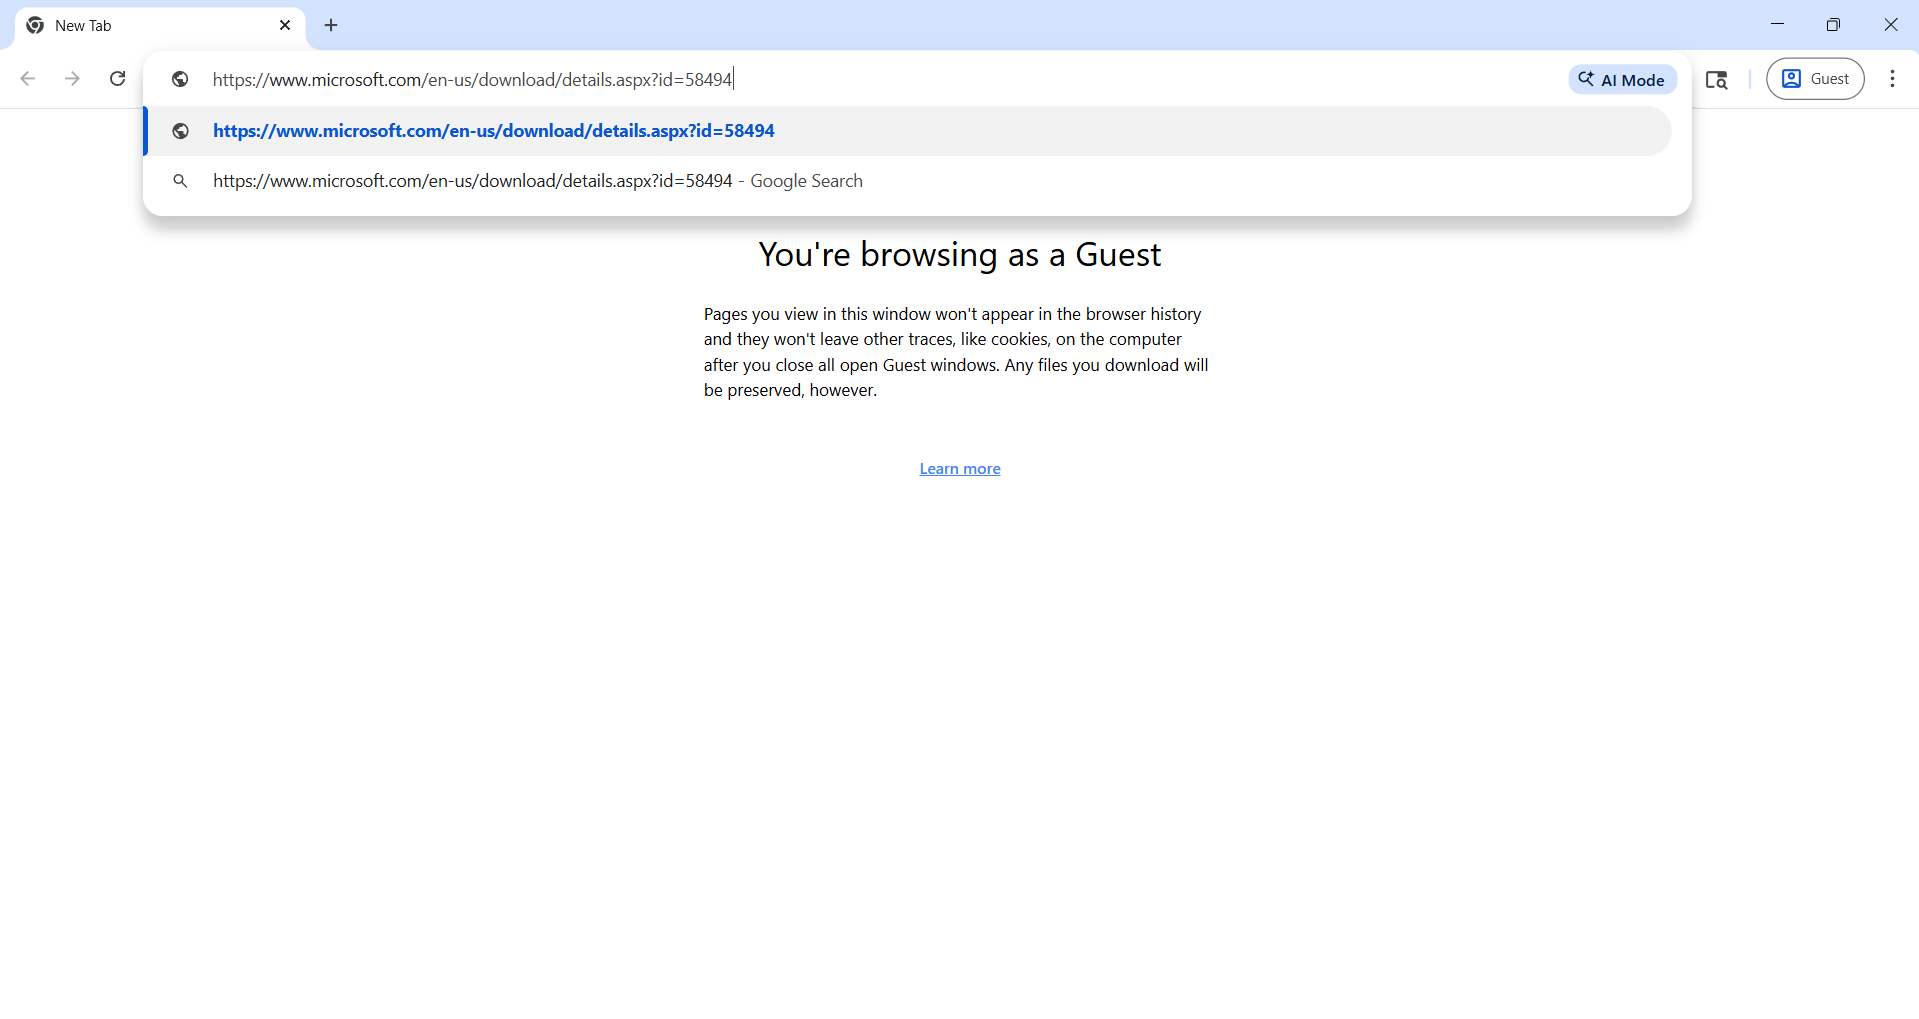
3
Press Enter Button
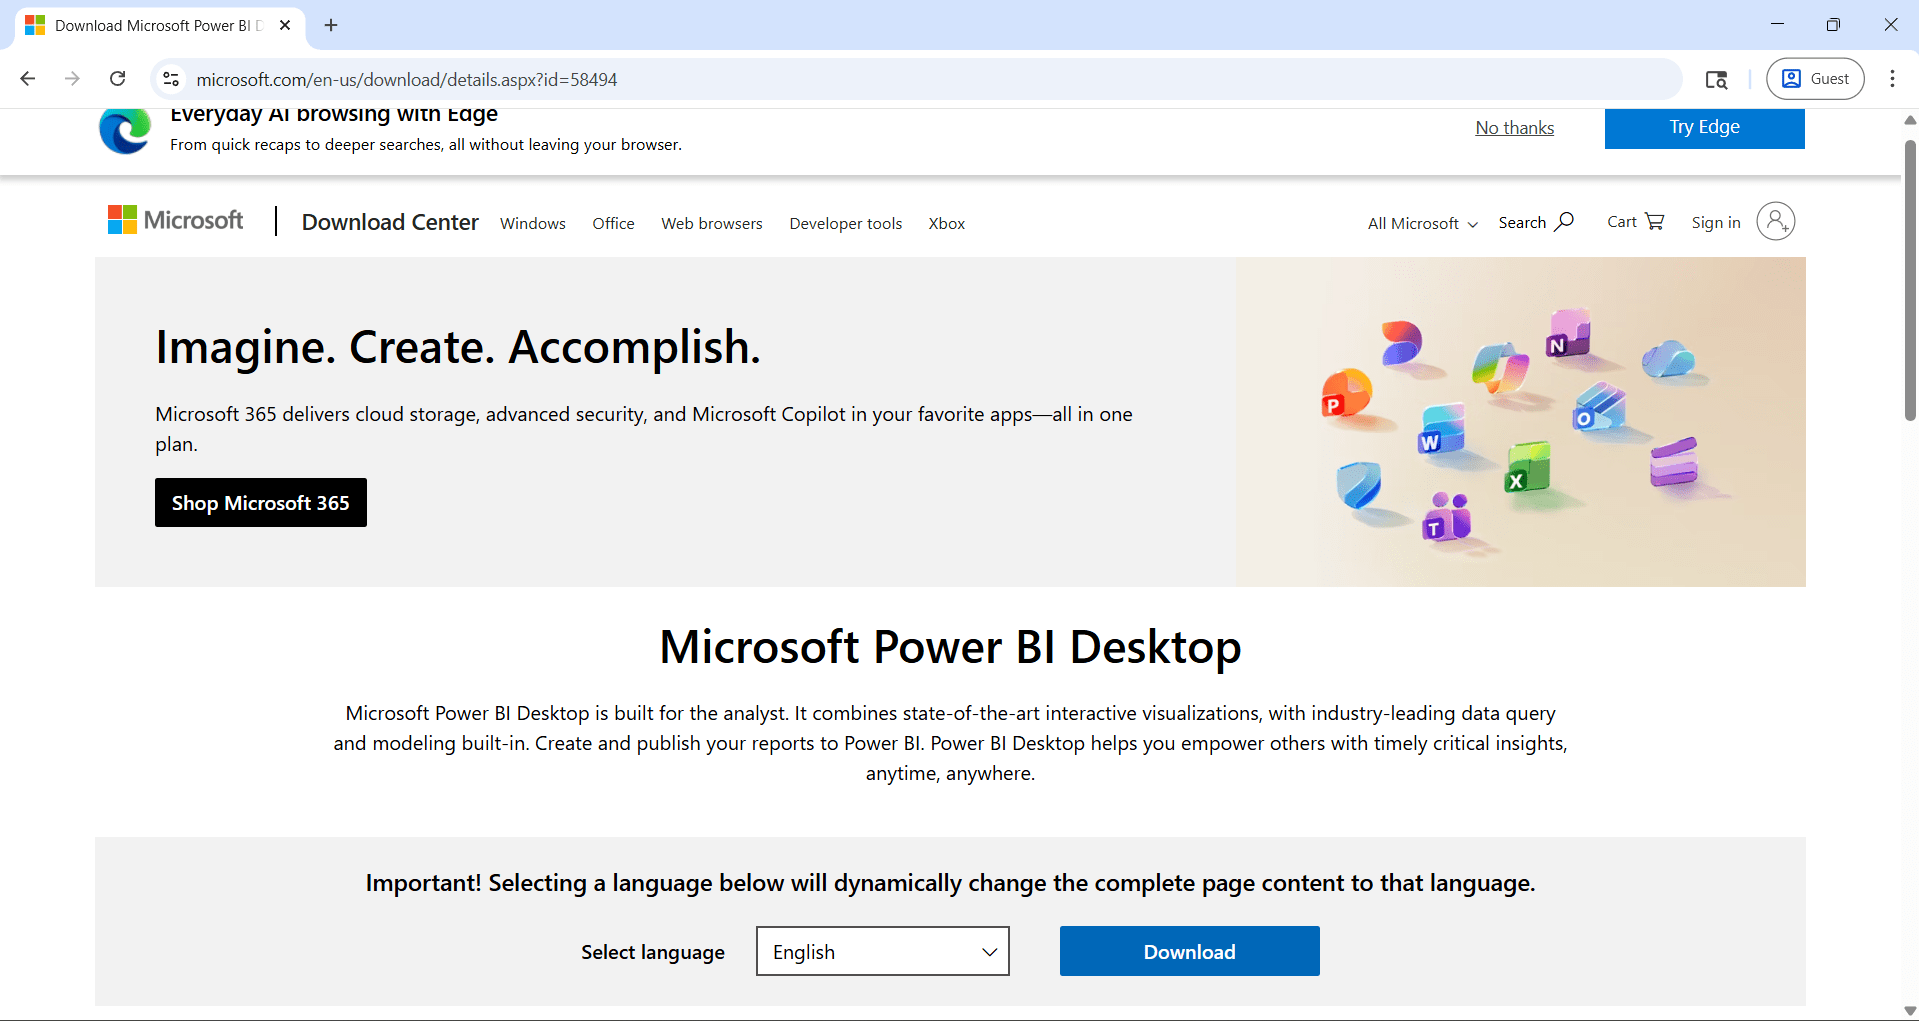
4
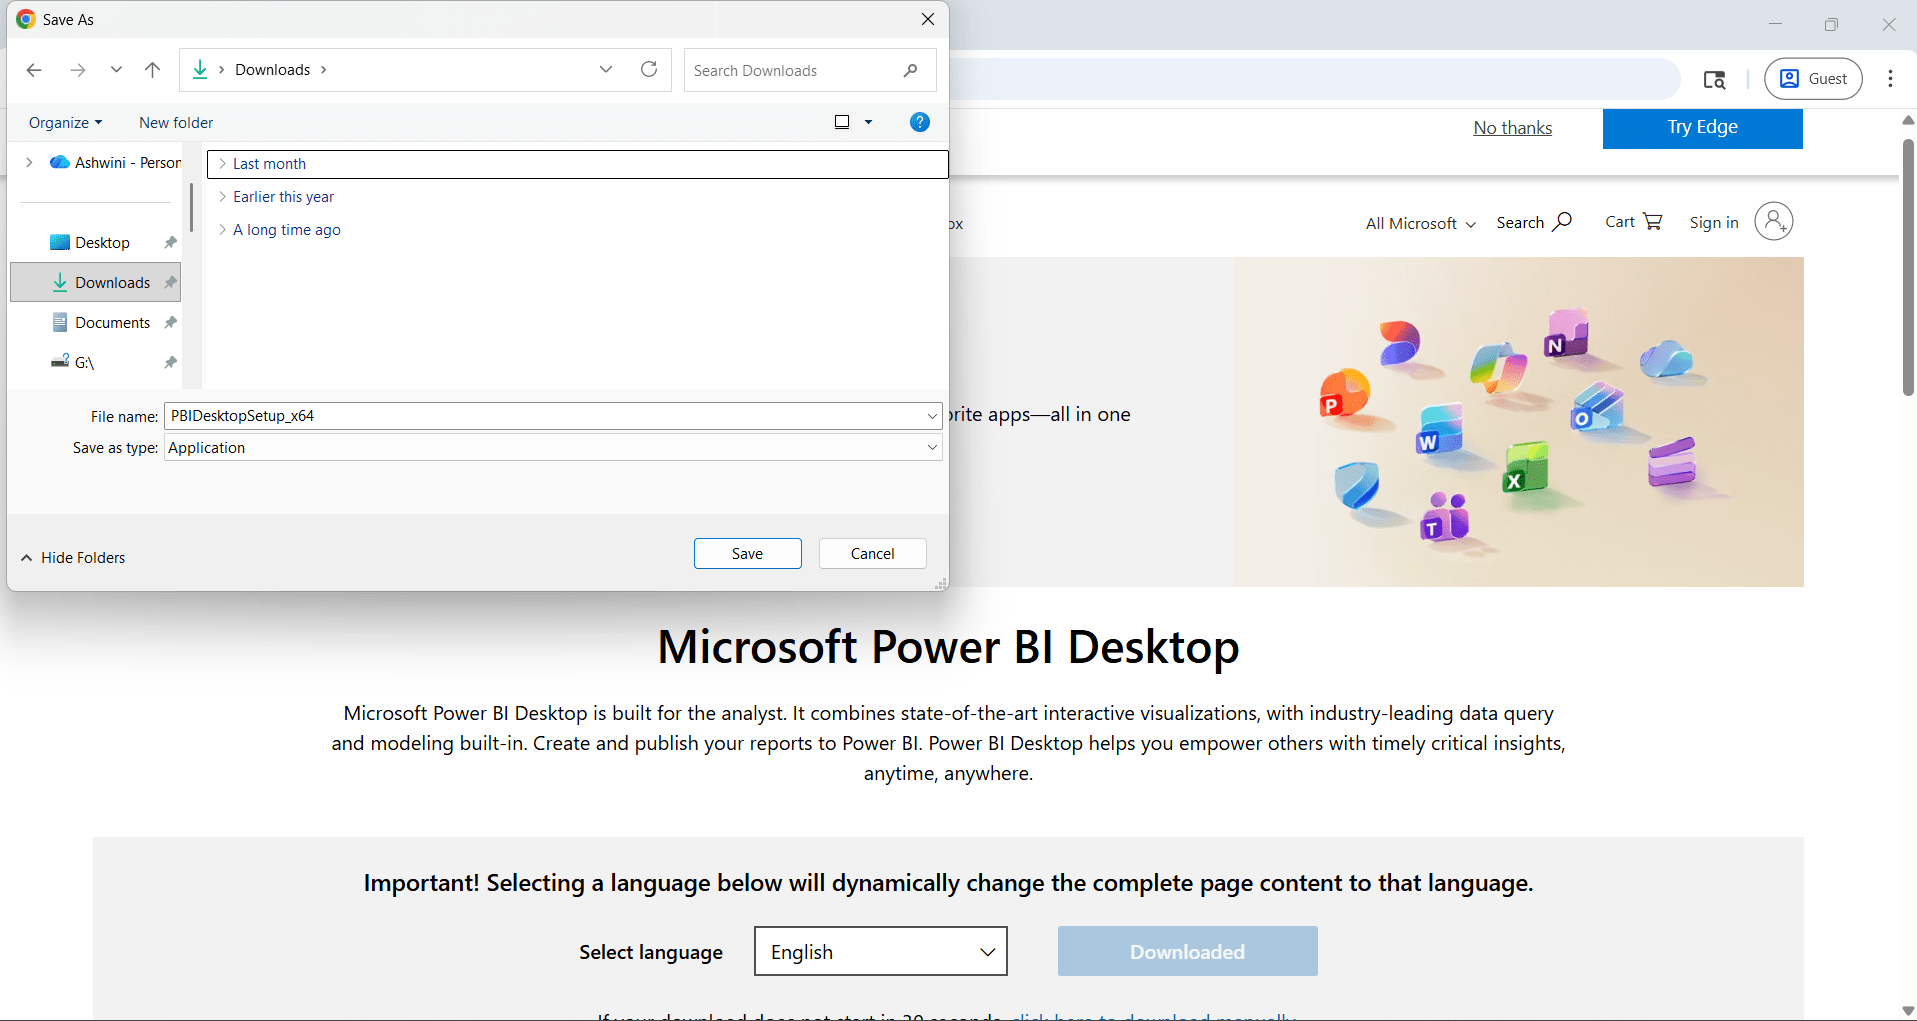
Click on Download button and select file location in your computer(download folders is recommended)
Click on Save Button
5
Right click on .exe file which you downloaded
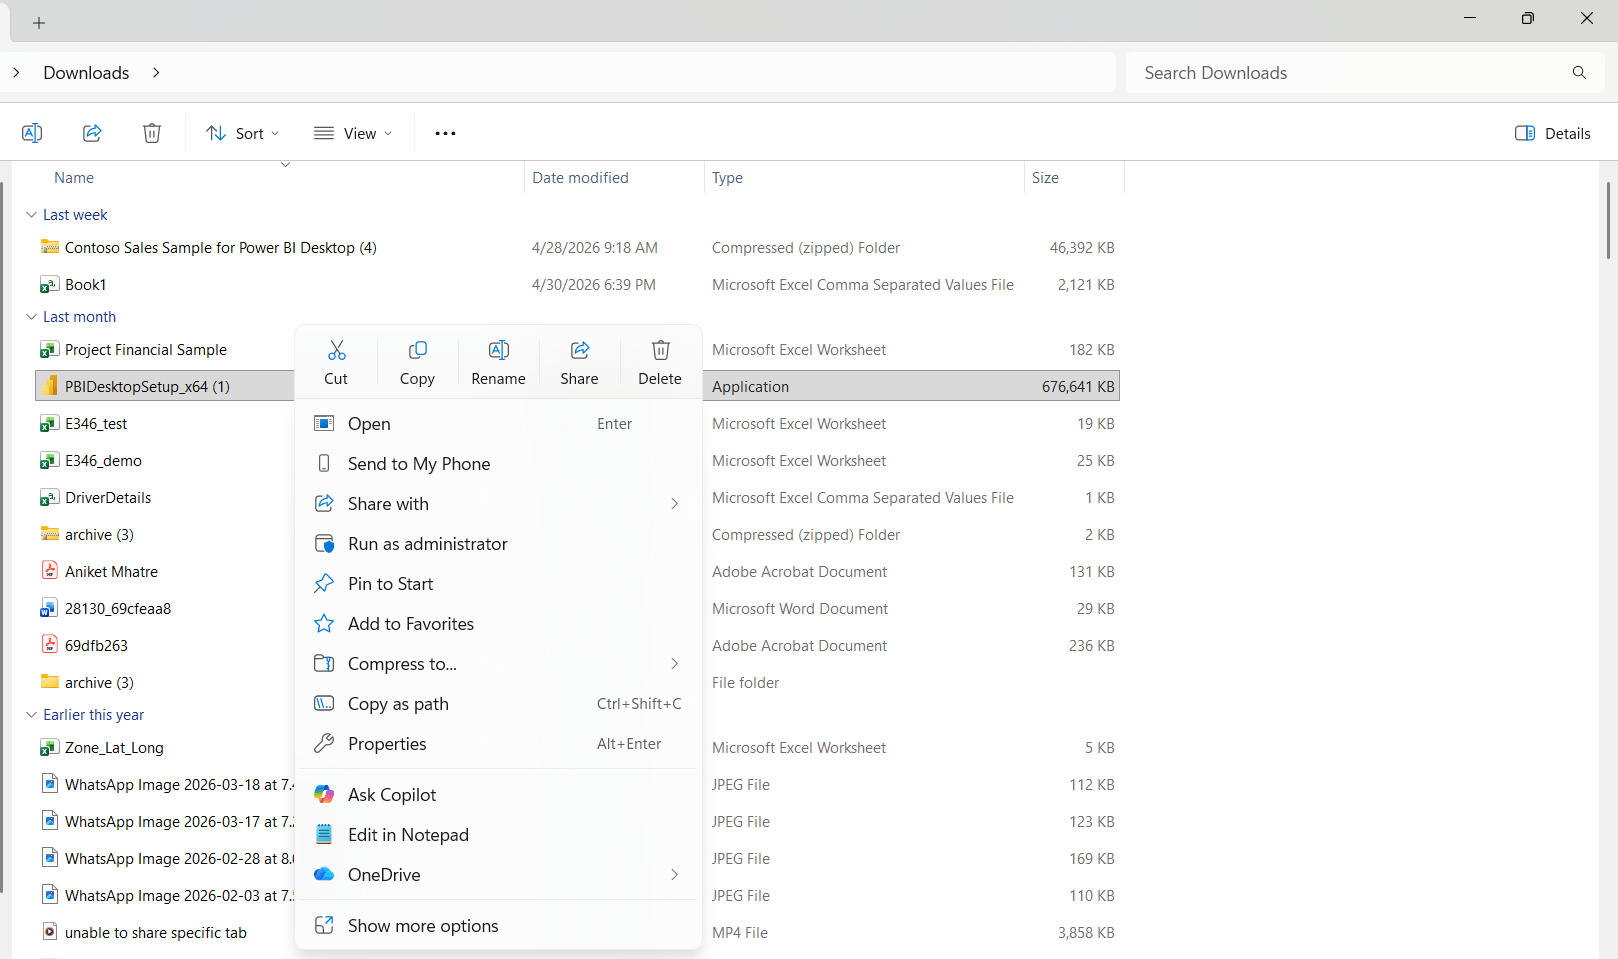
6
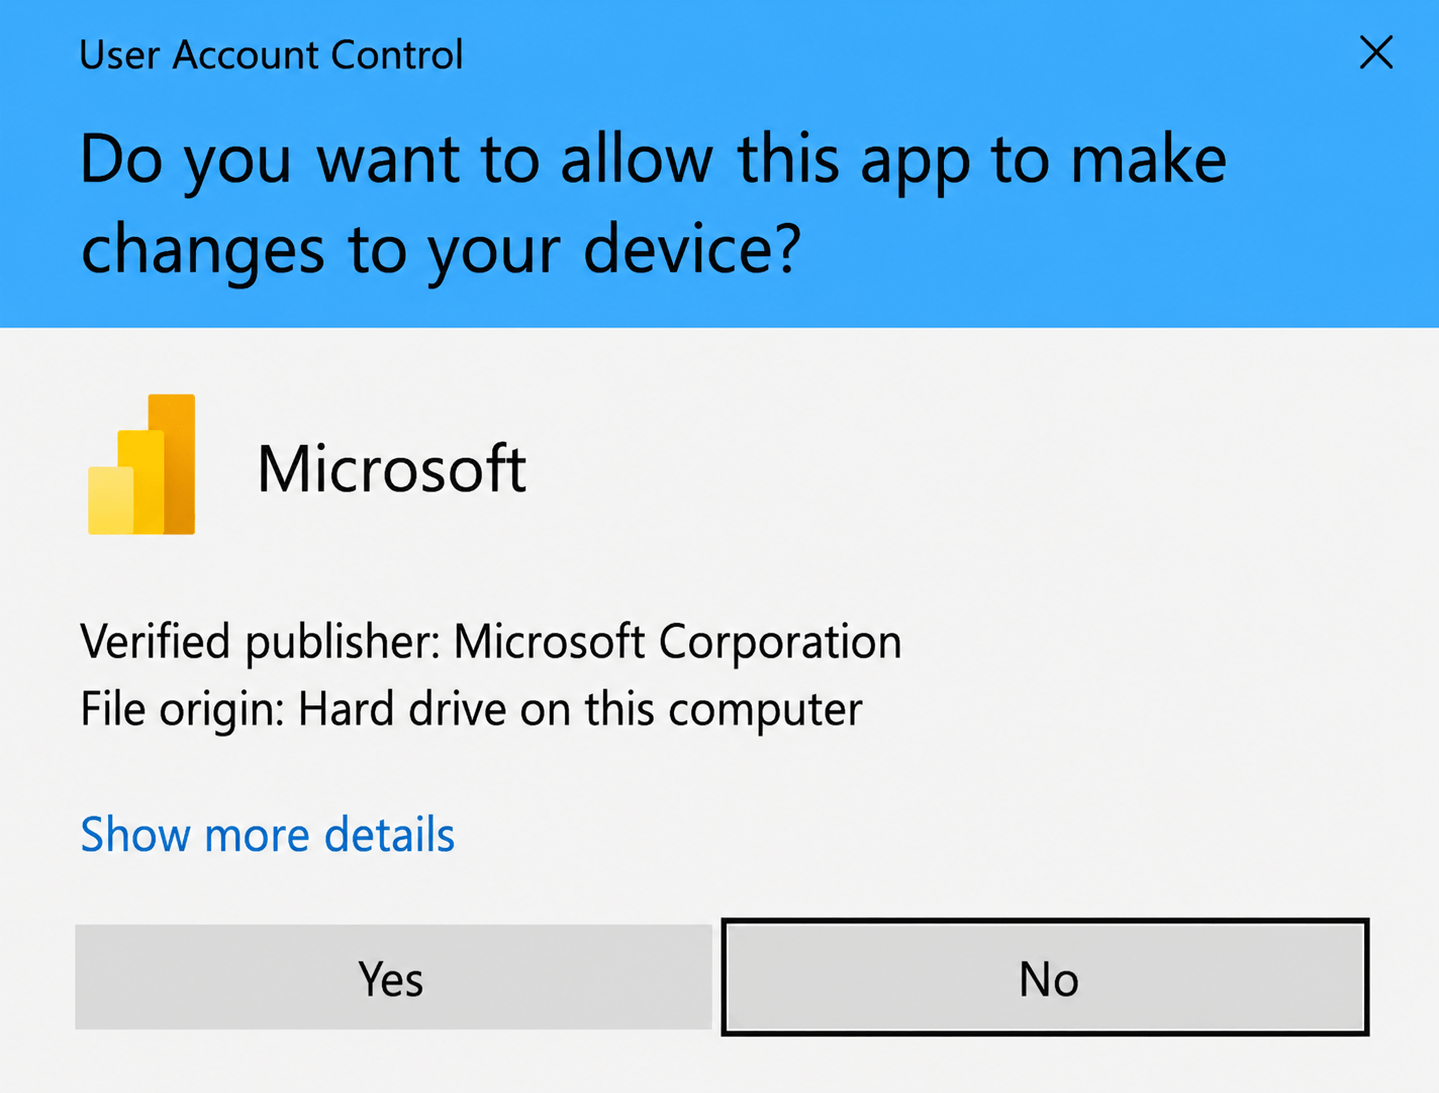
Click on run as administrator
Click on Yes Button
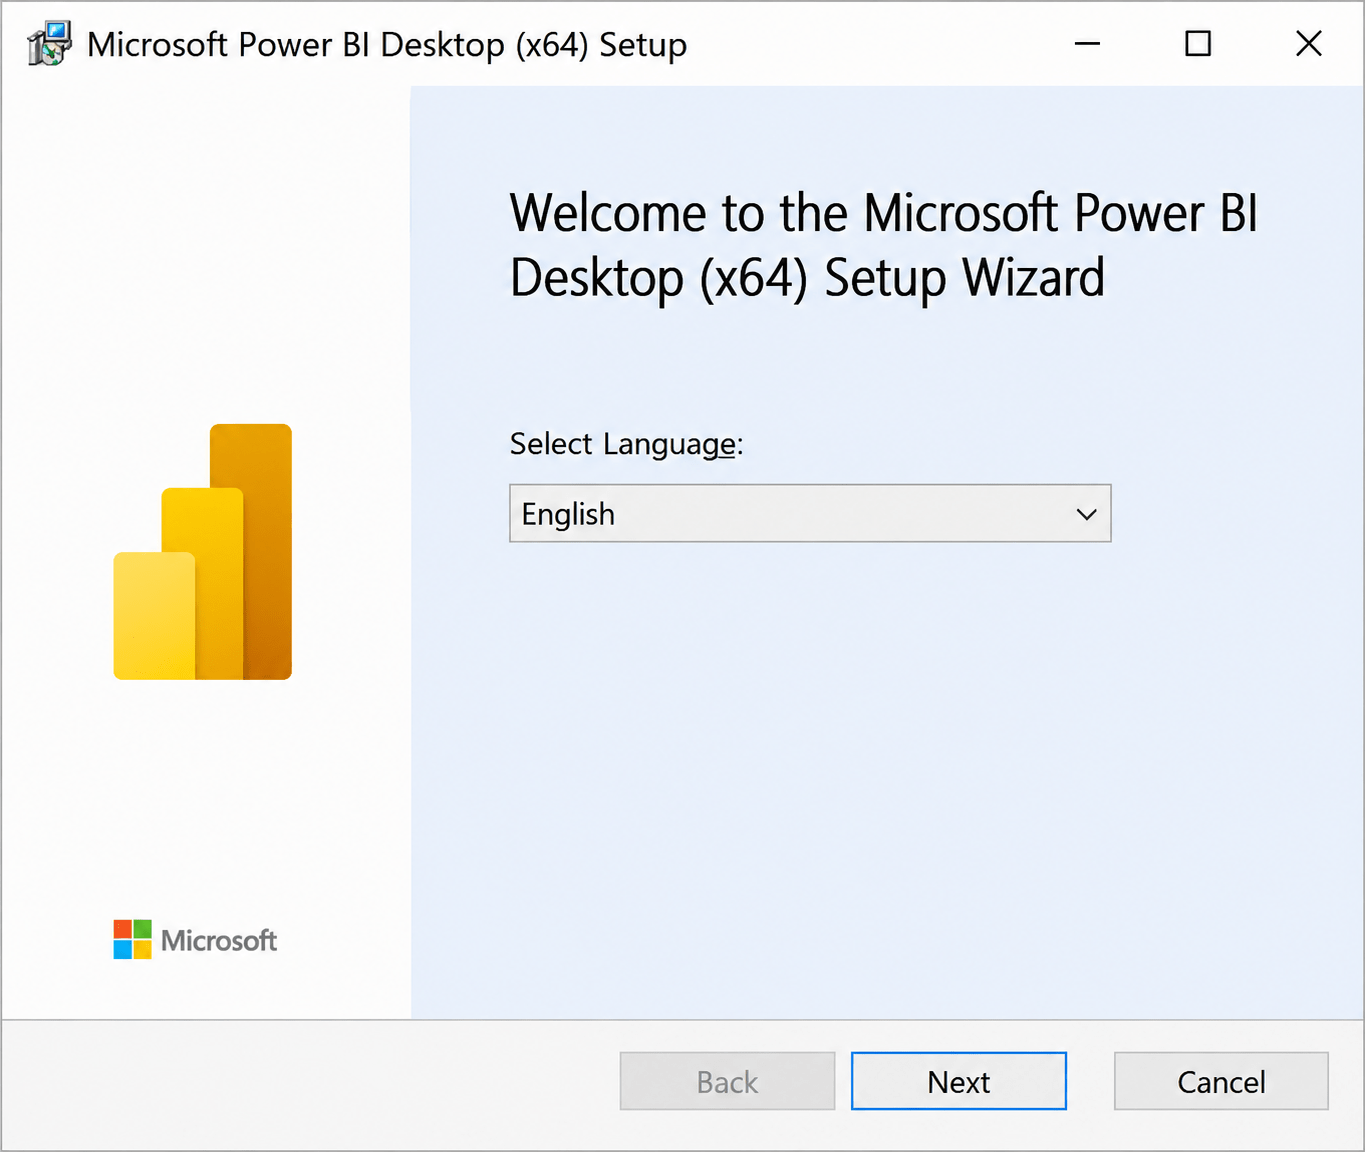
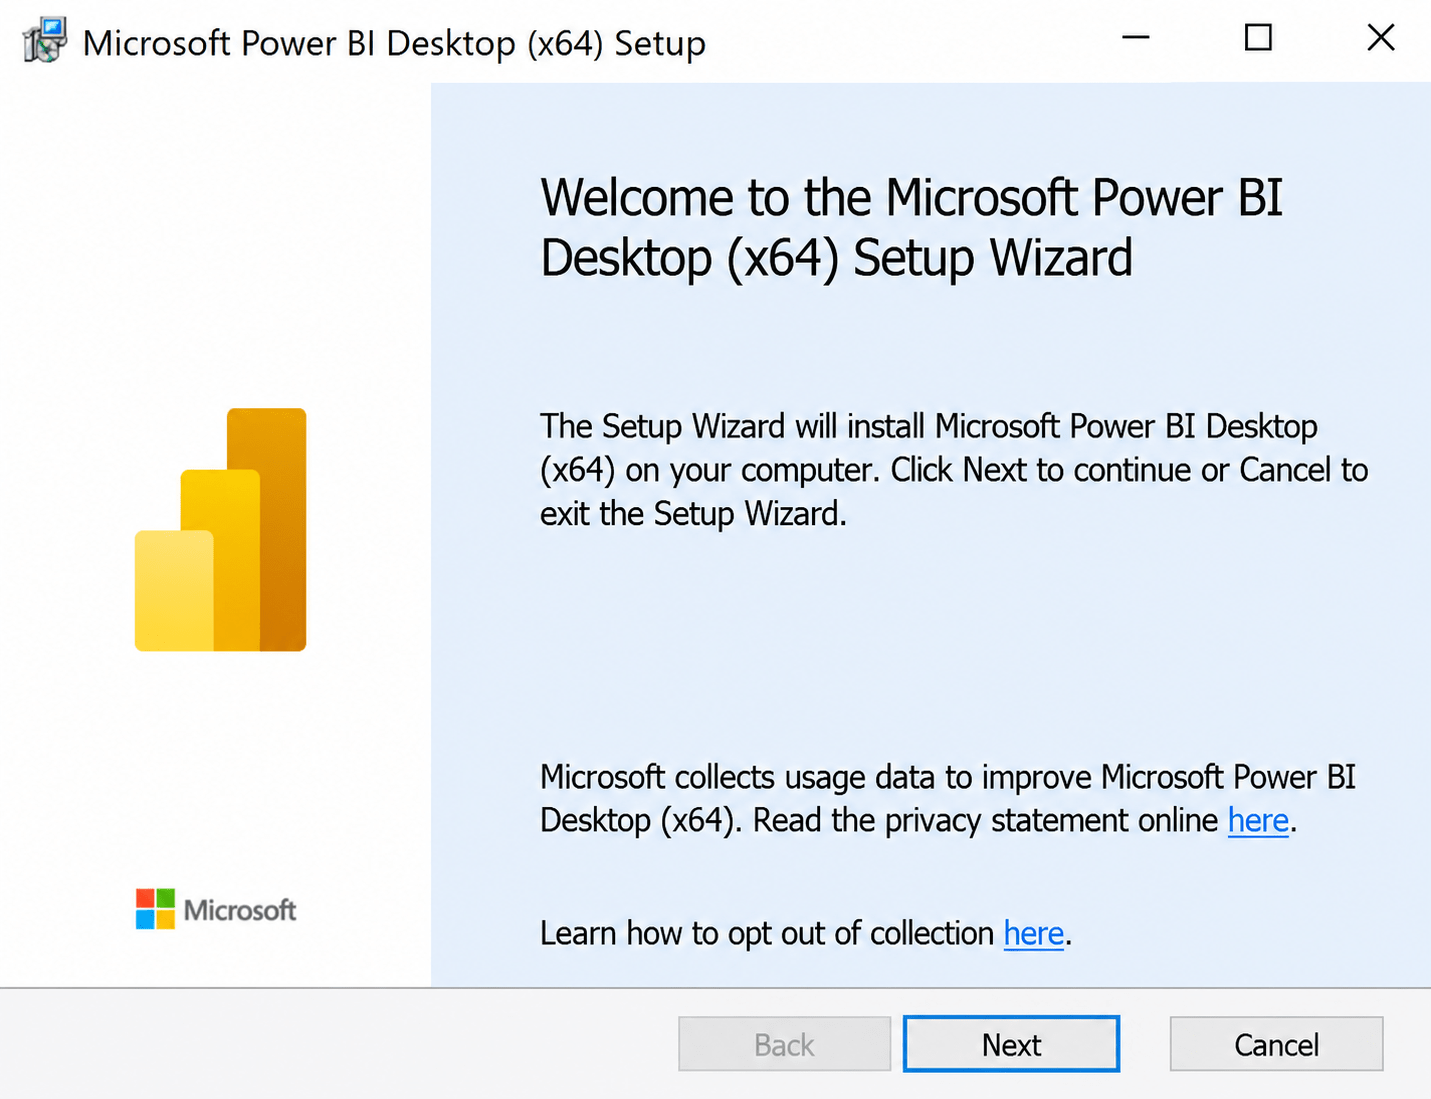
7
Click on next button
8
Click on next
9
Again click on next and select checkbox of agree
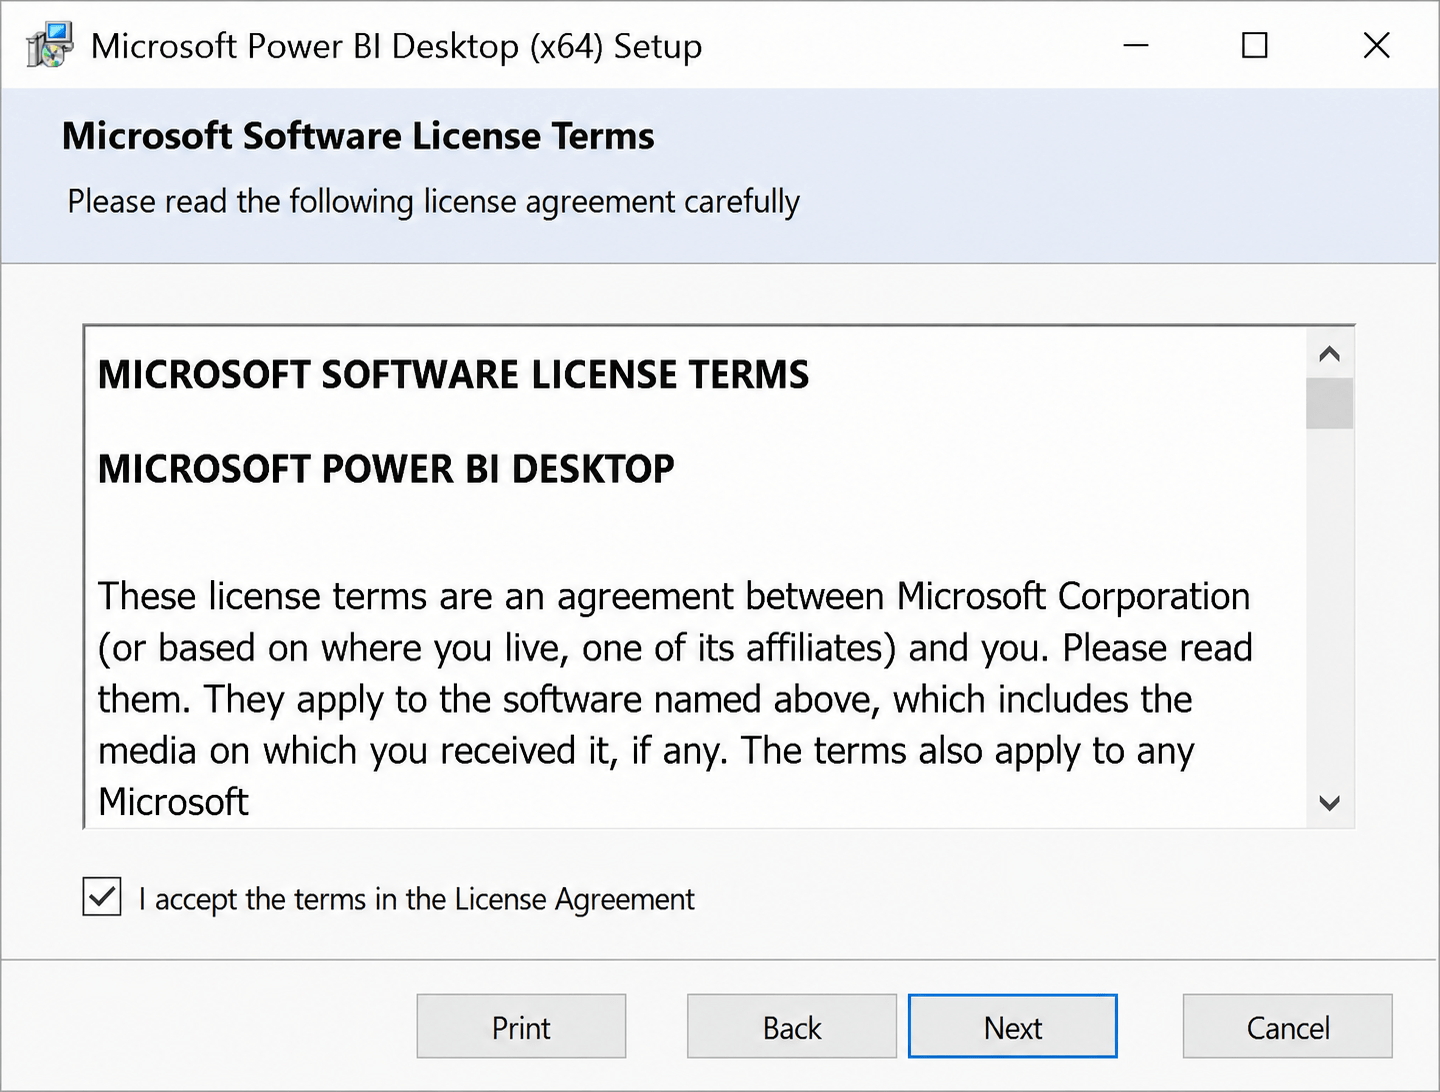
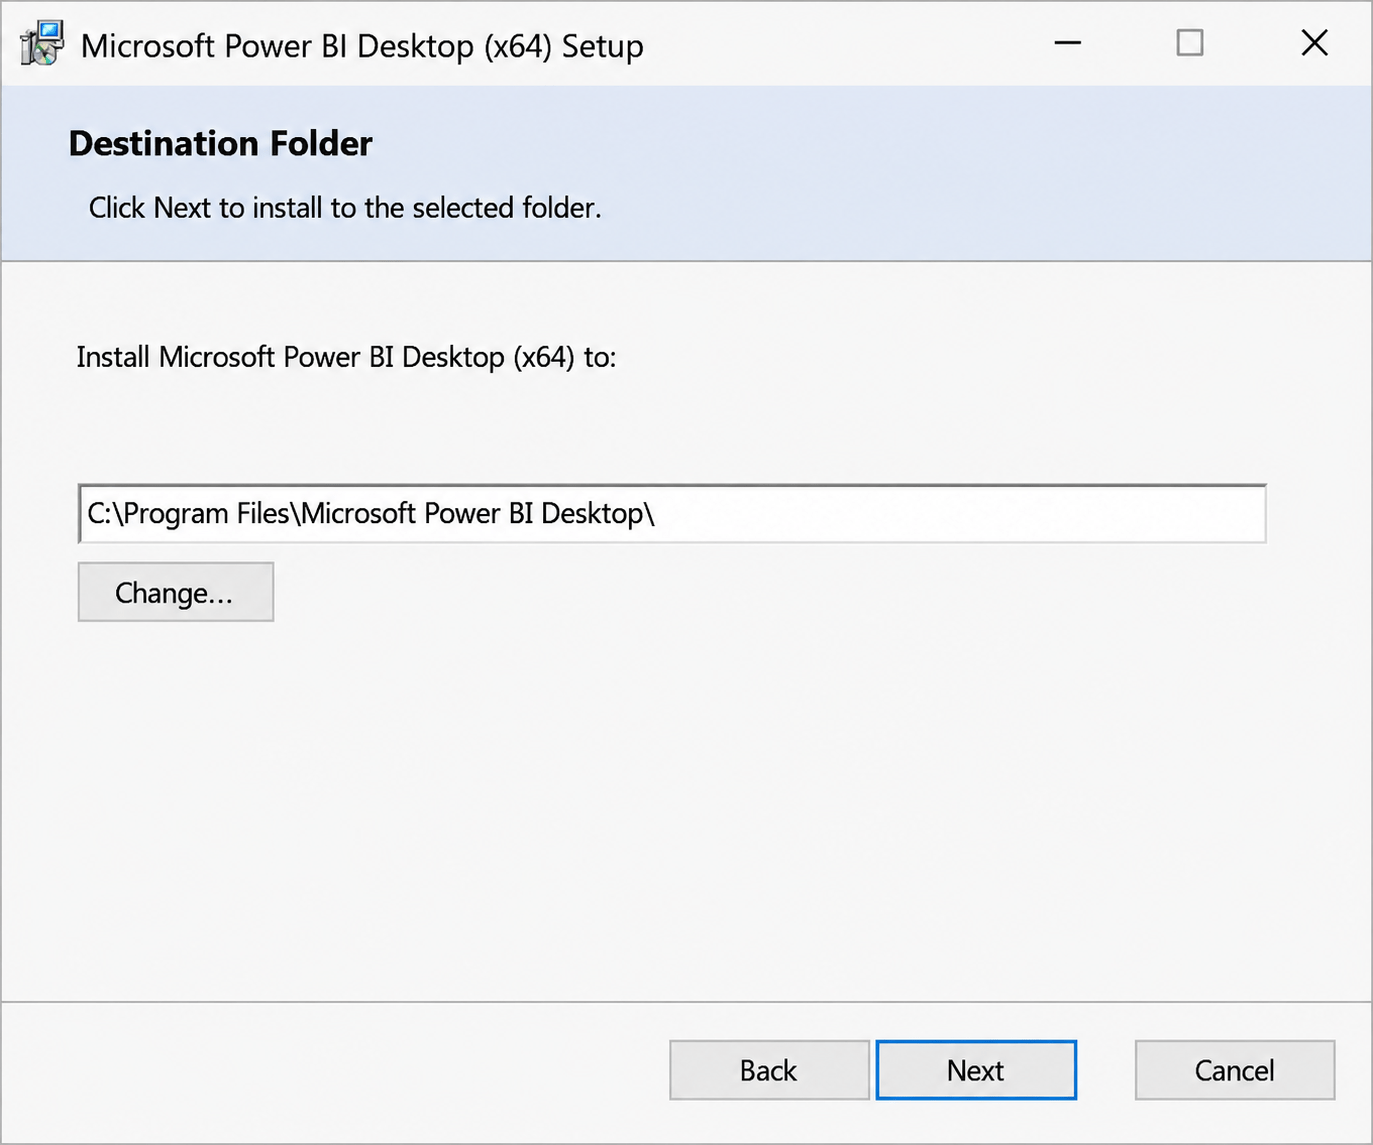
10
Click on next
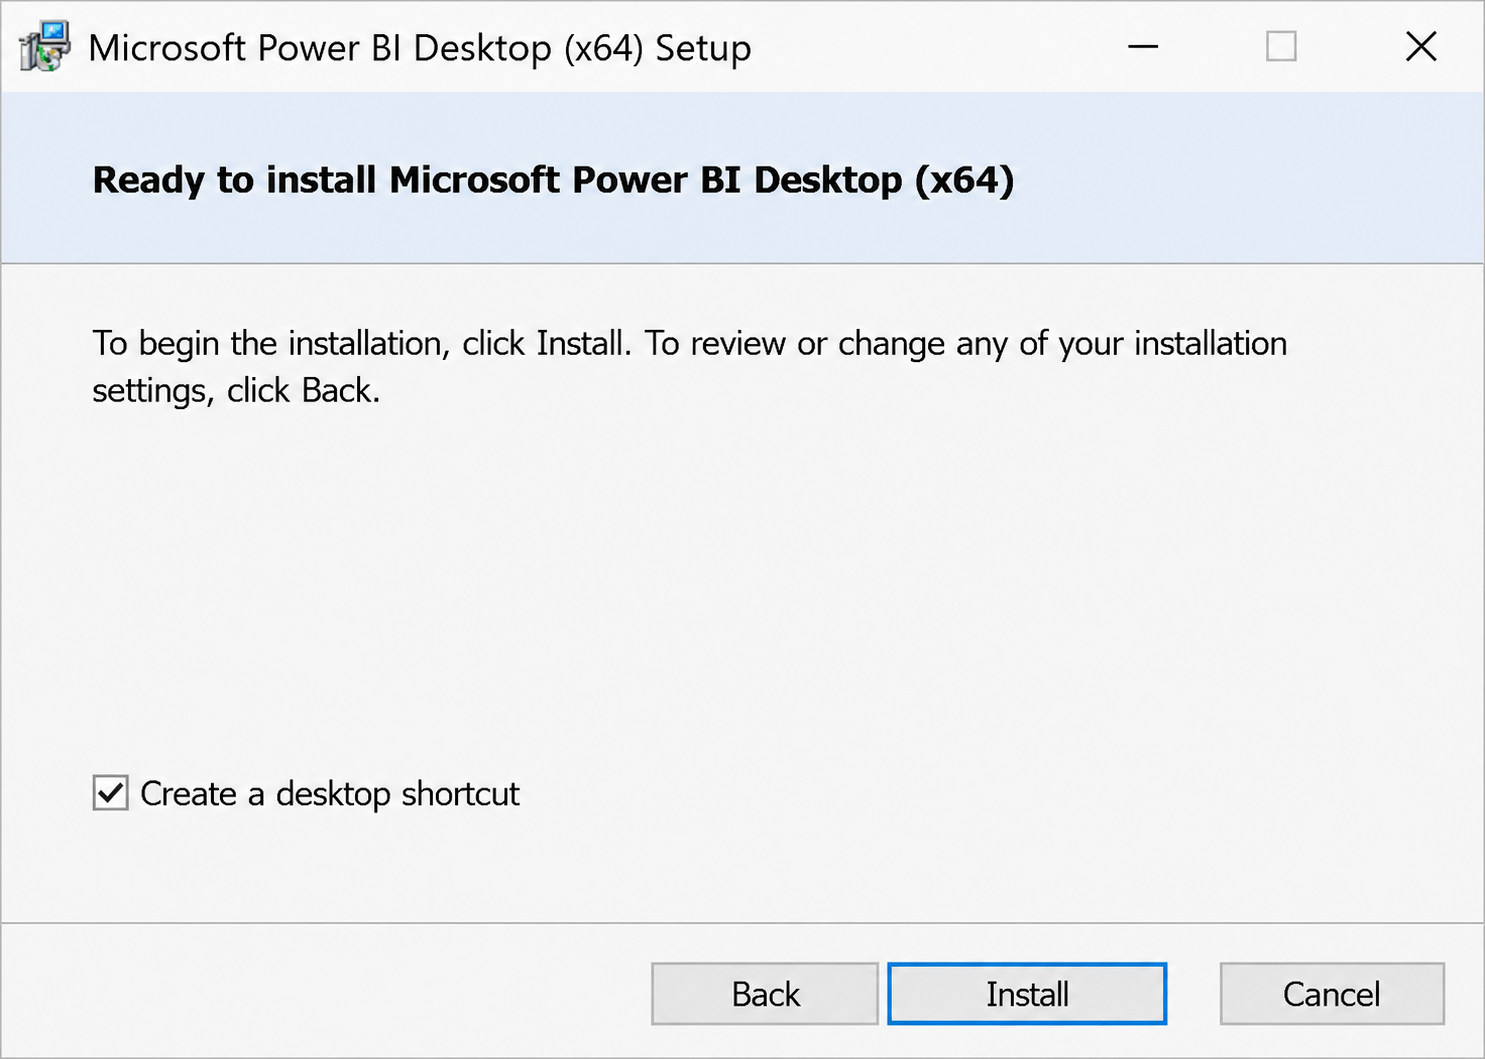
11
Click on install button
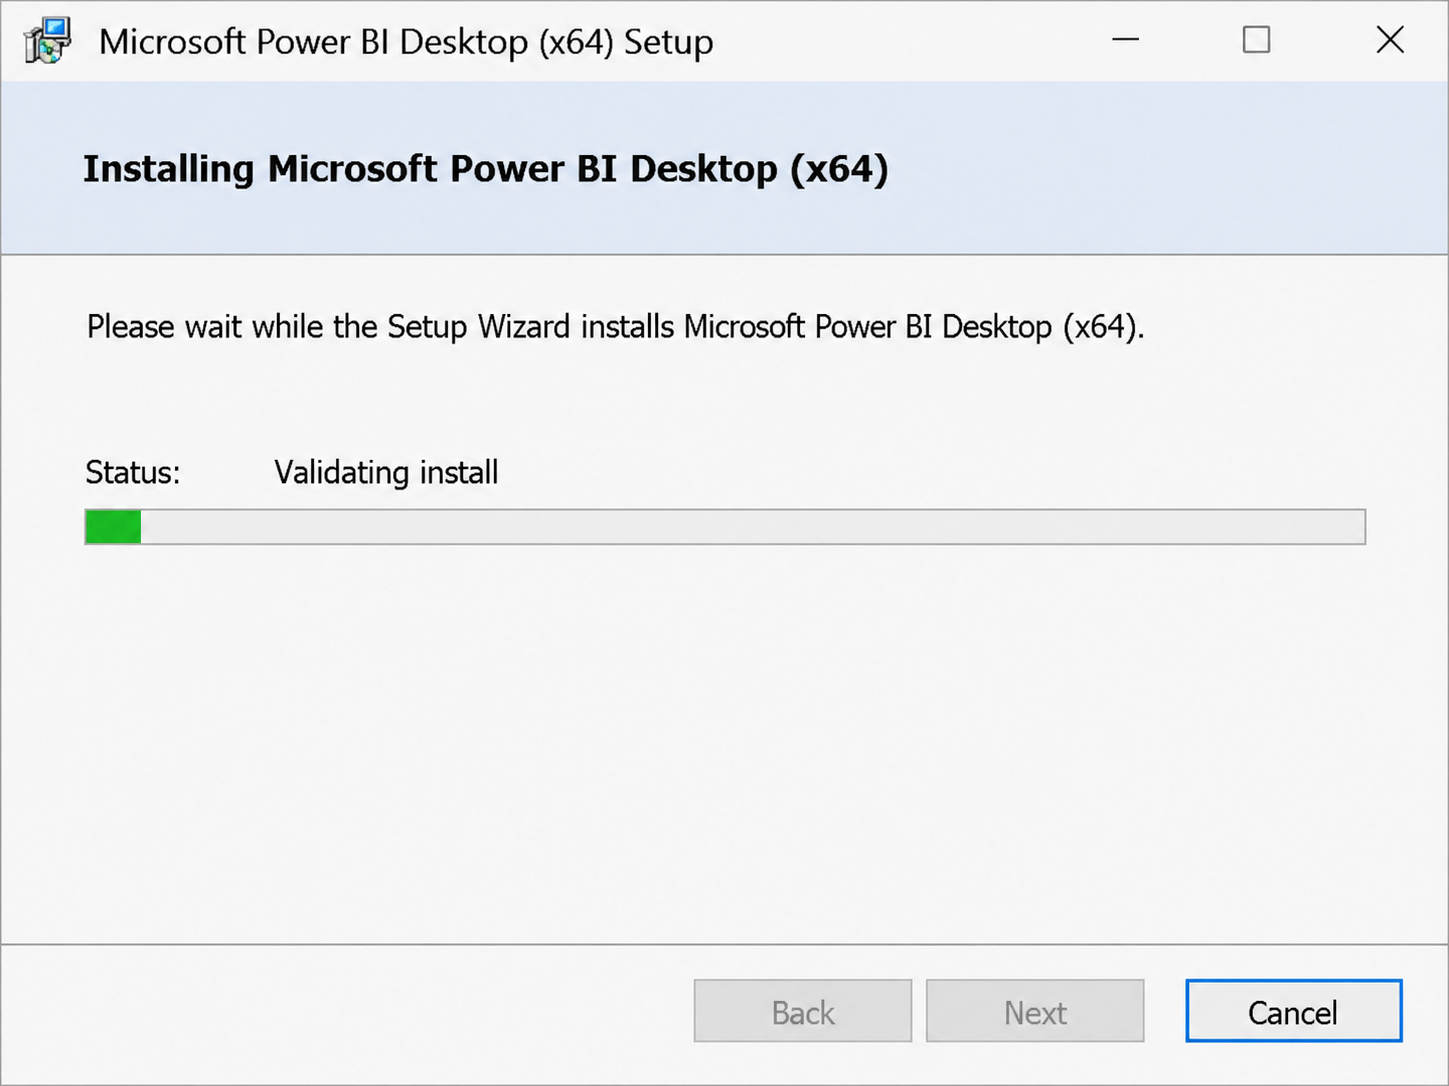
12
Wait till Installation Completes
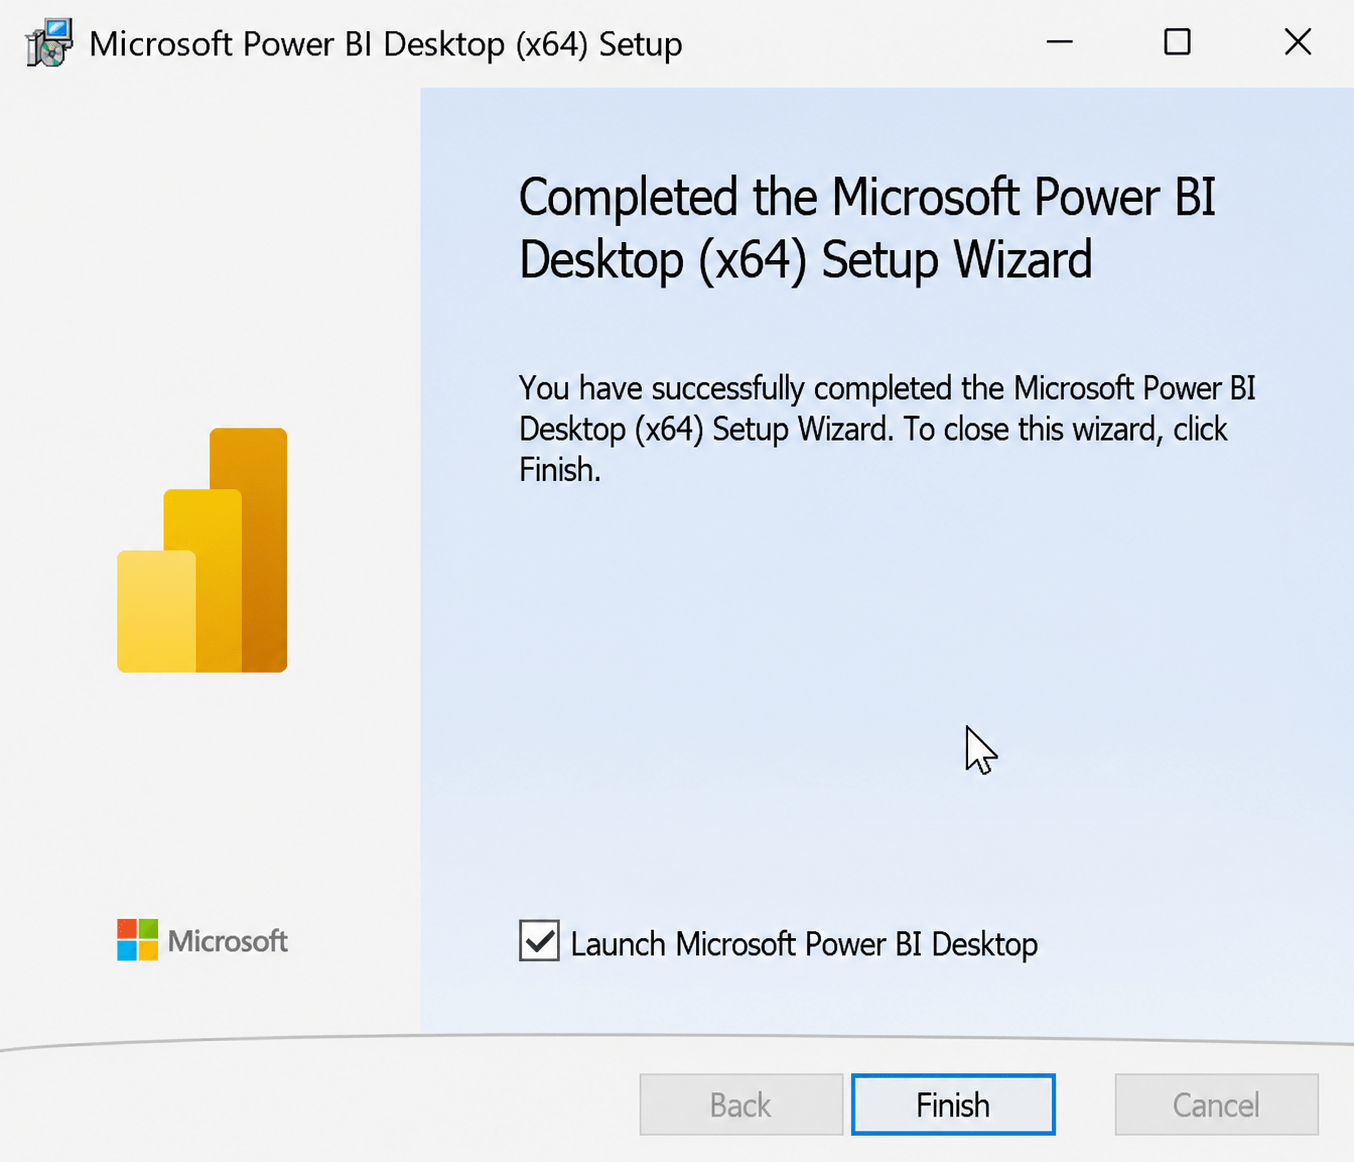
13
Click on Finish Button
You have successfully installed Power BI
Task 2: Connecting with data sources in Power BI desktop
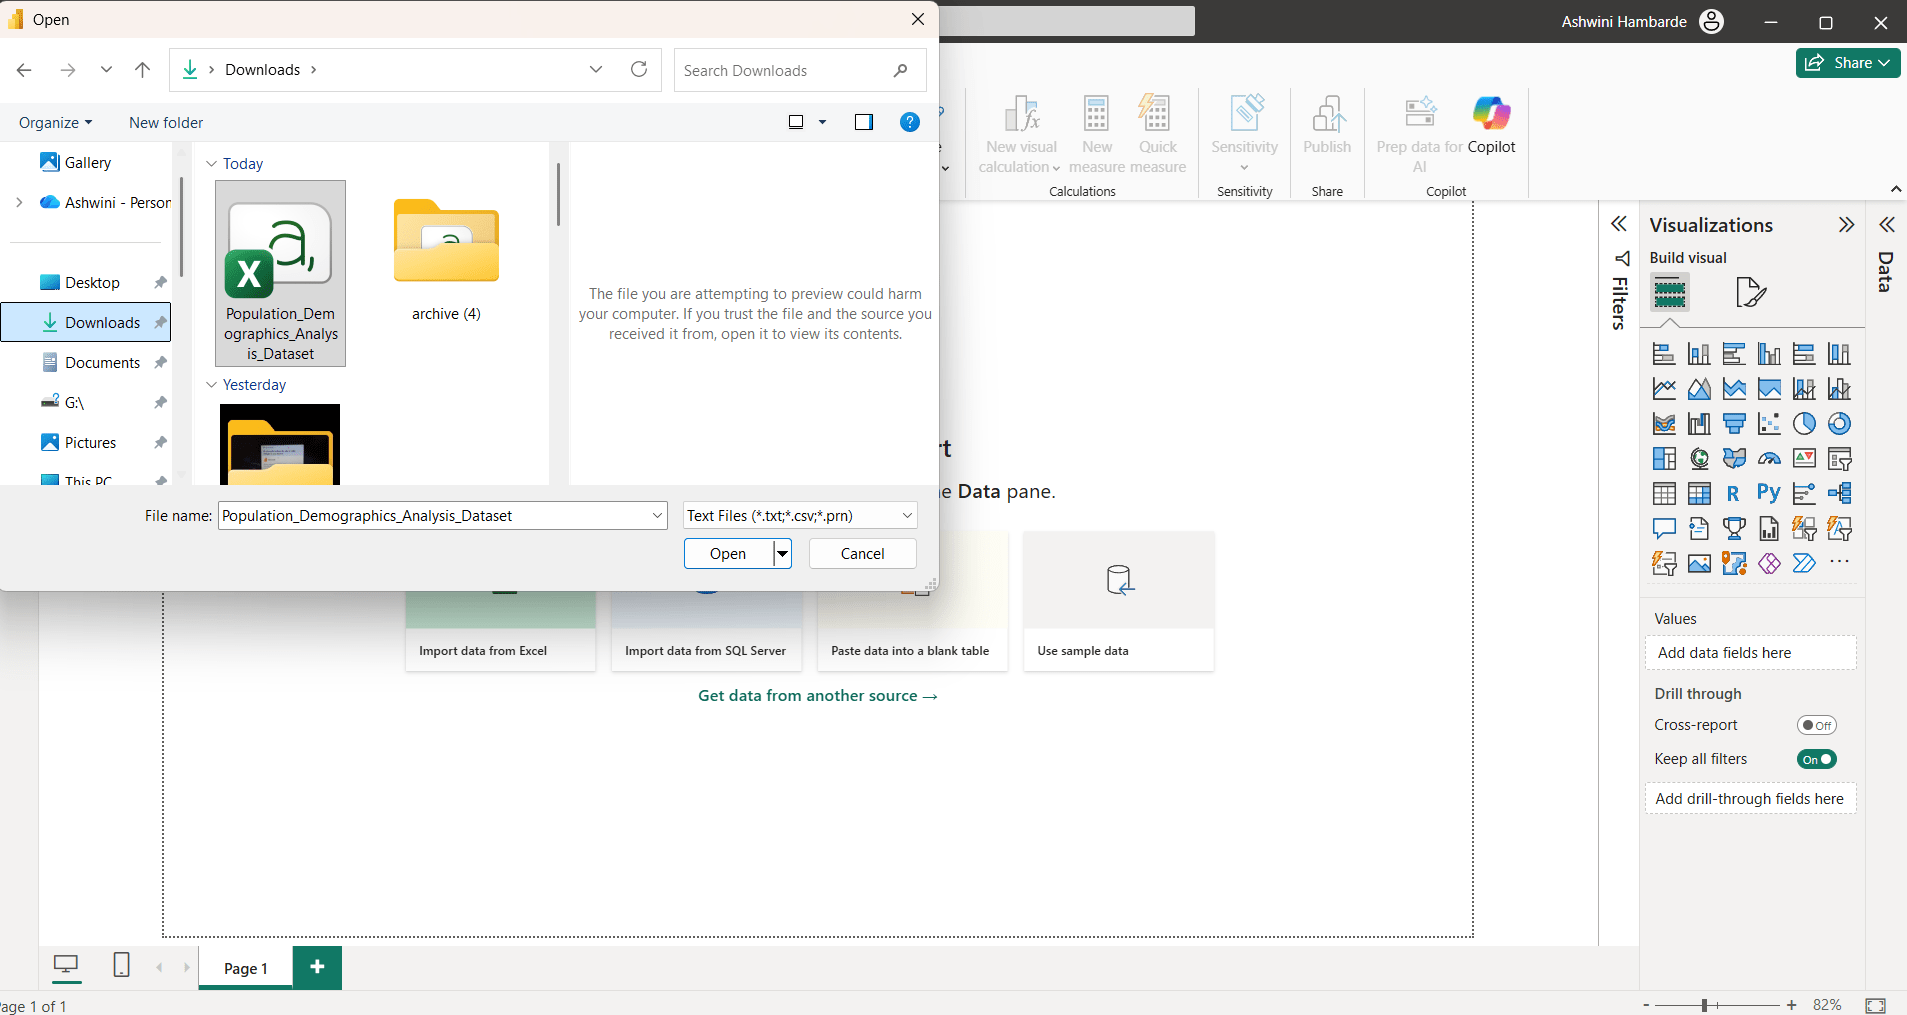
1
Download Dataset
Dataset Link : Population Demographic Analysis
Open Power BI desktop
2
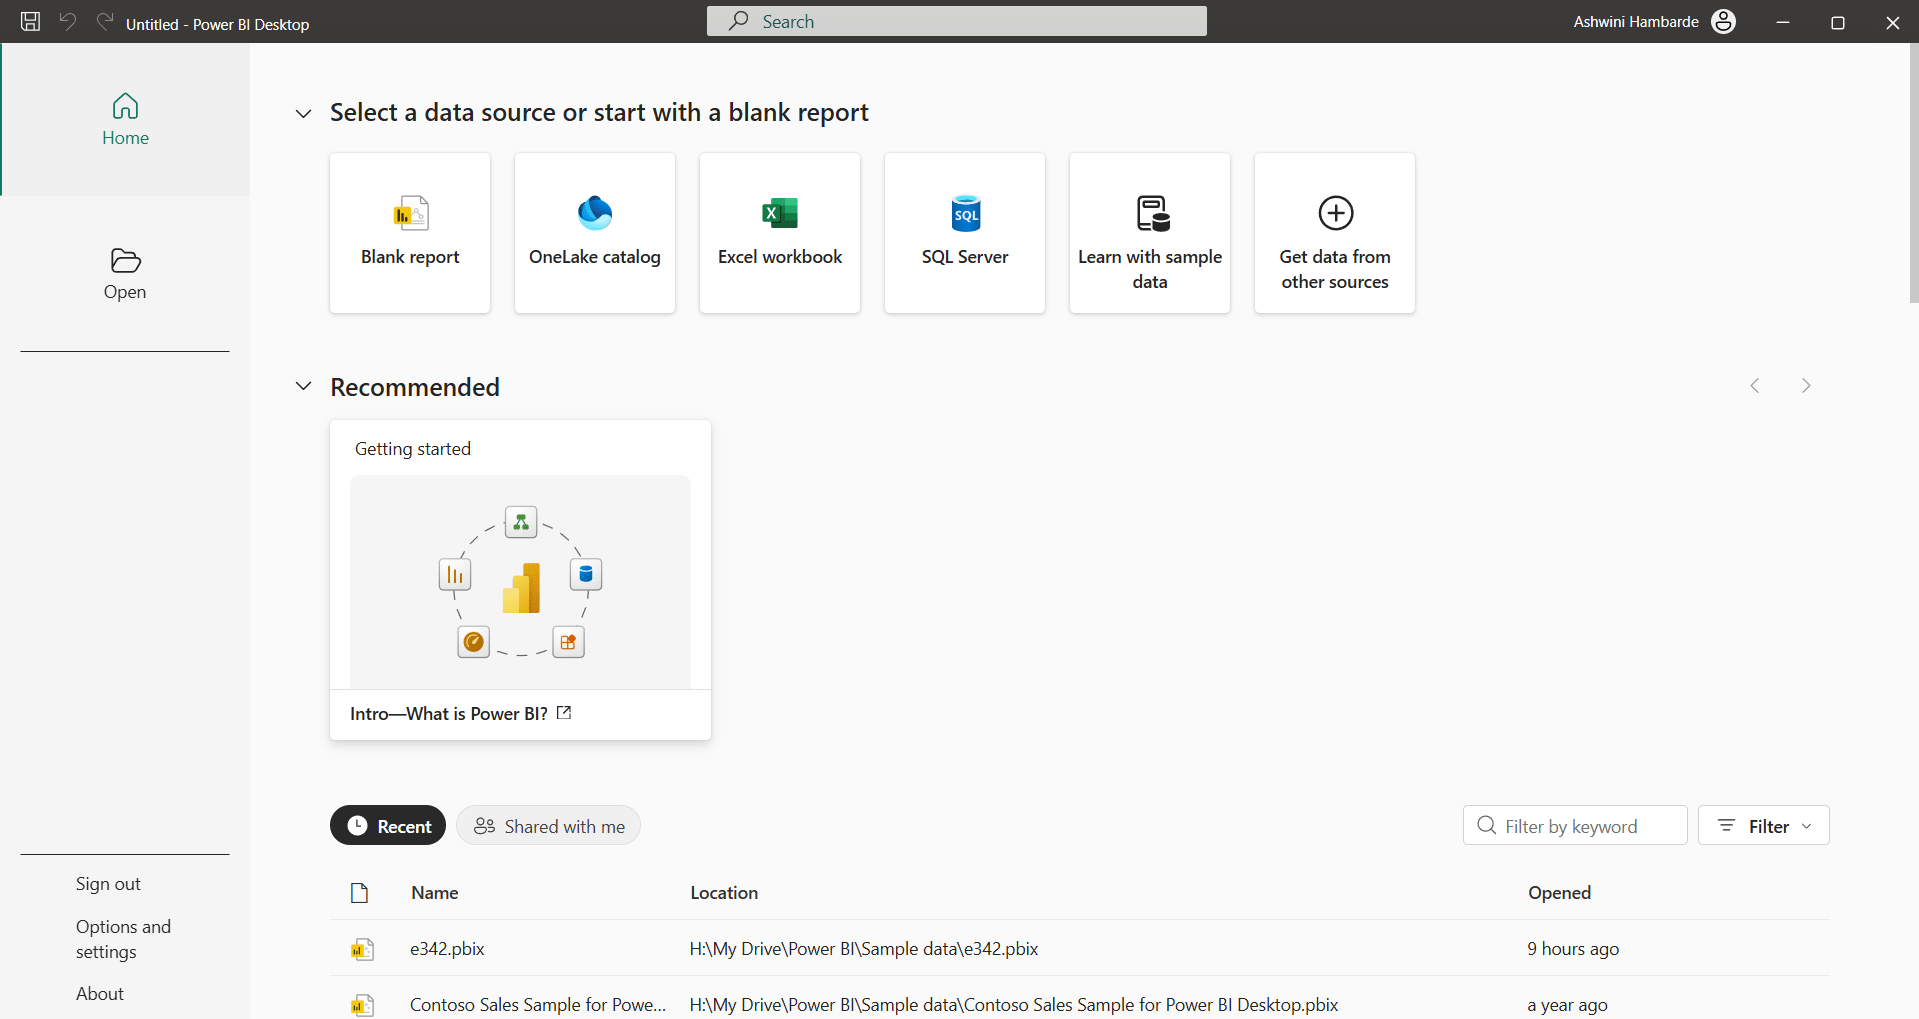
3
Click on Blank Report
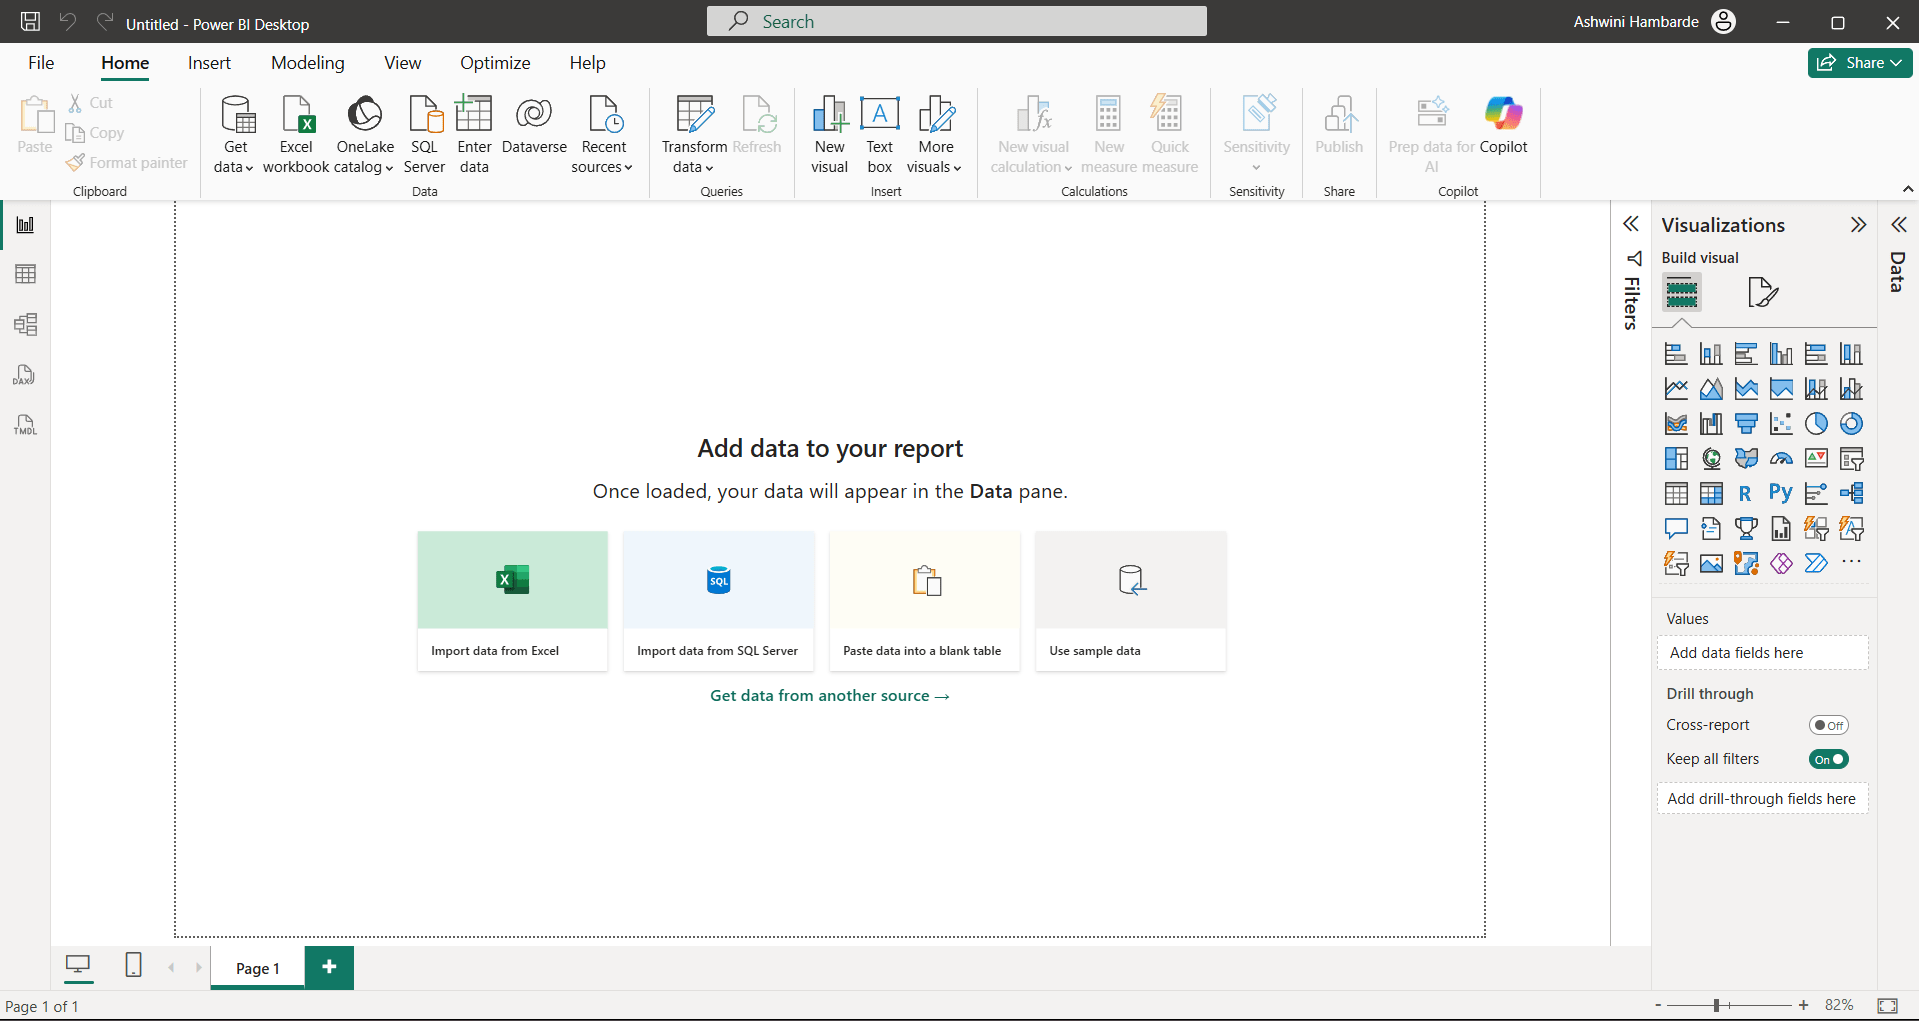
4
Click on the Get Data in Home tab
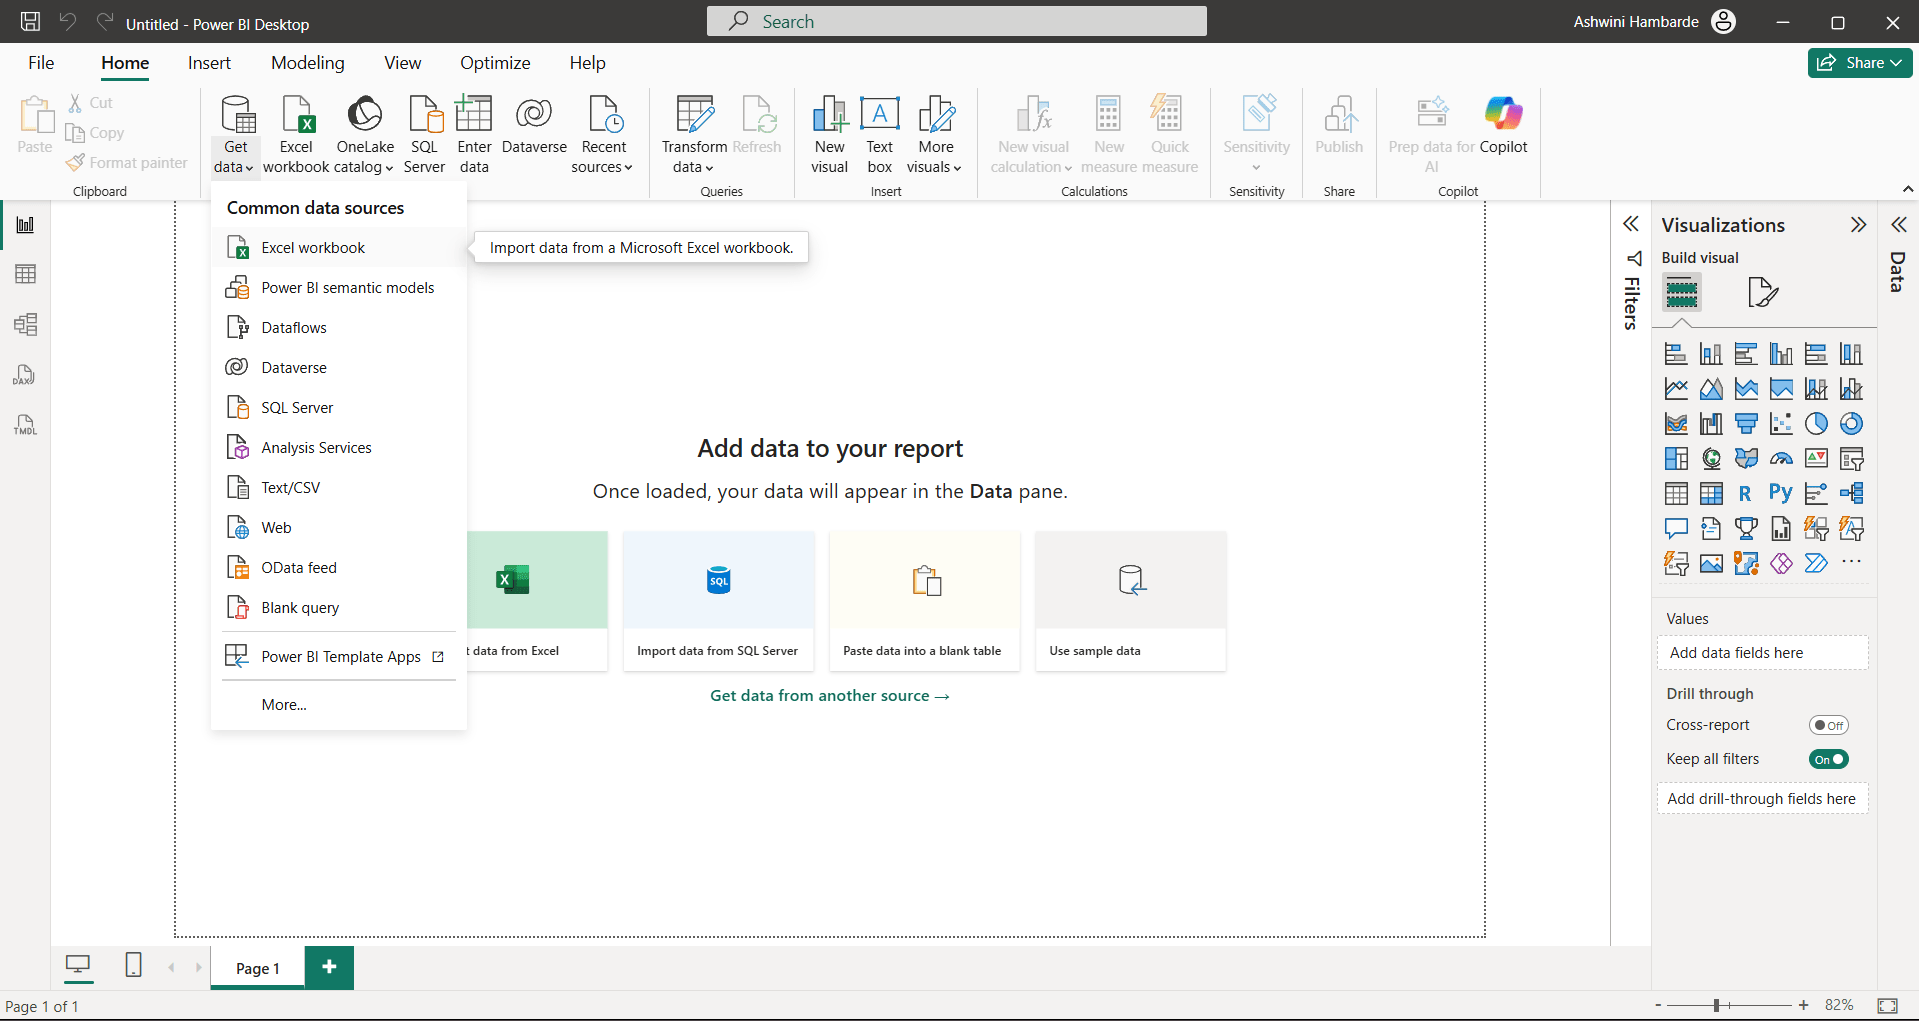
5
Depending on type of dataset, we can select file type, our file is .csv so we can select Text/CSV file type
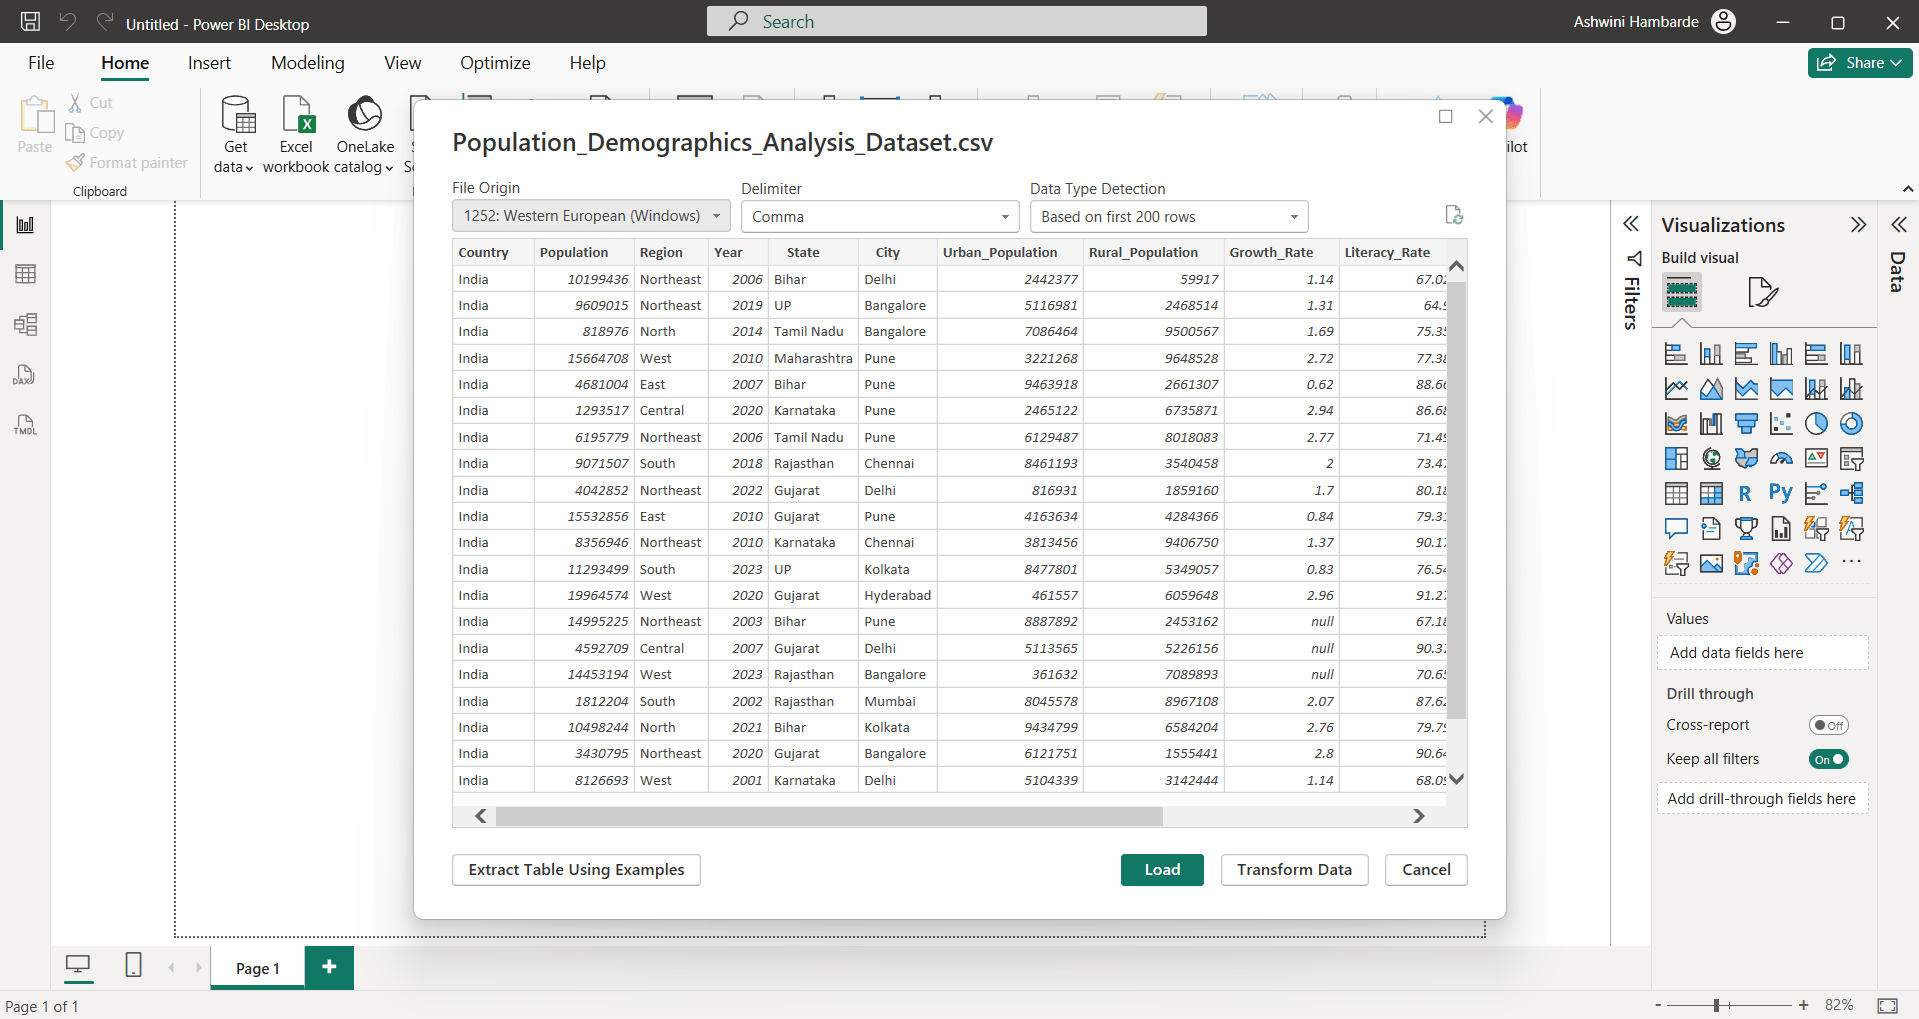
6
Select Load Option
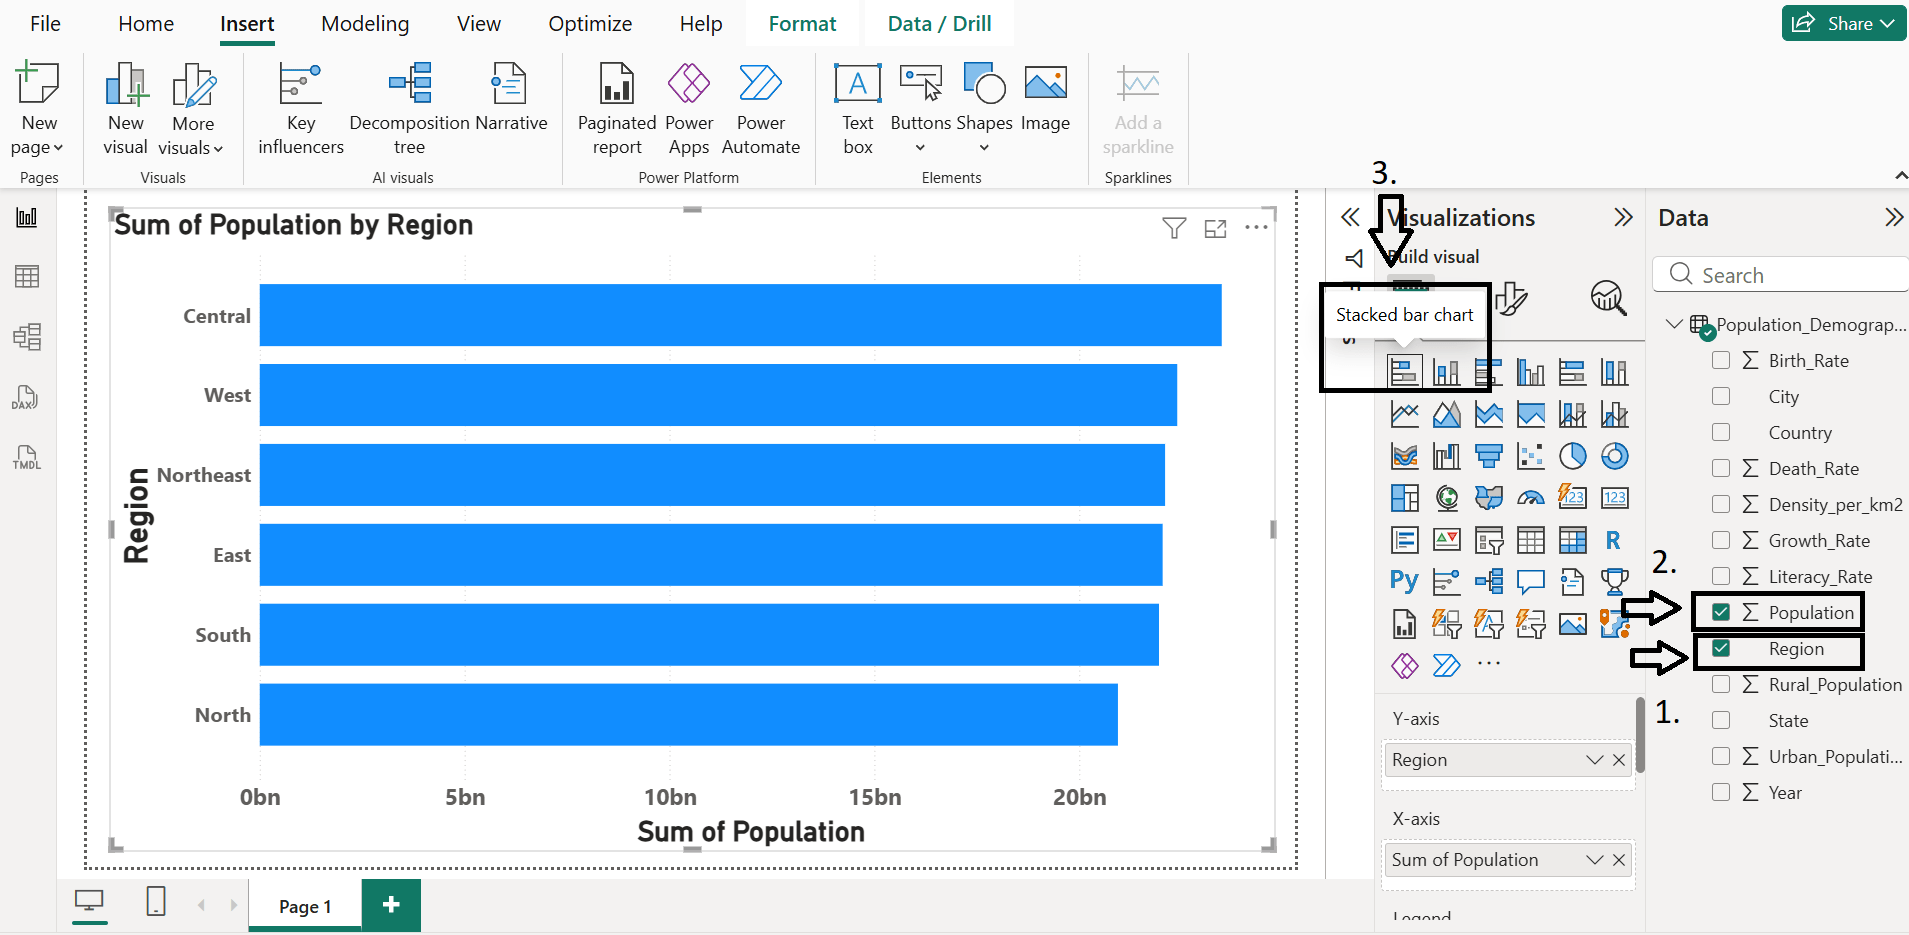
Task 3: Add Key Insights
1
Click on 1st visual template in visualization pane
Identify : 1) Region with Highest Population 2) Geographic distribution
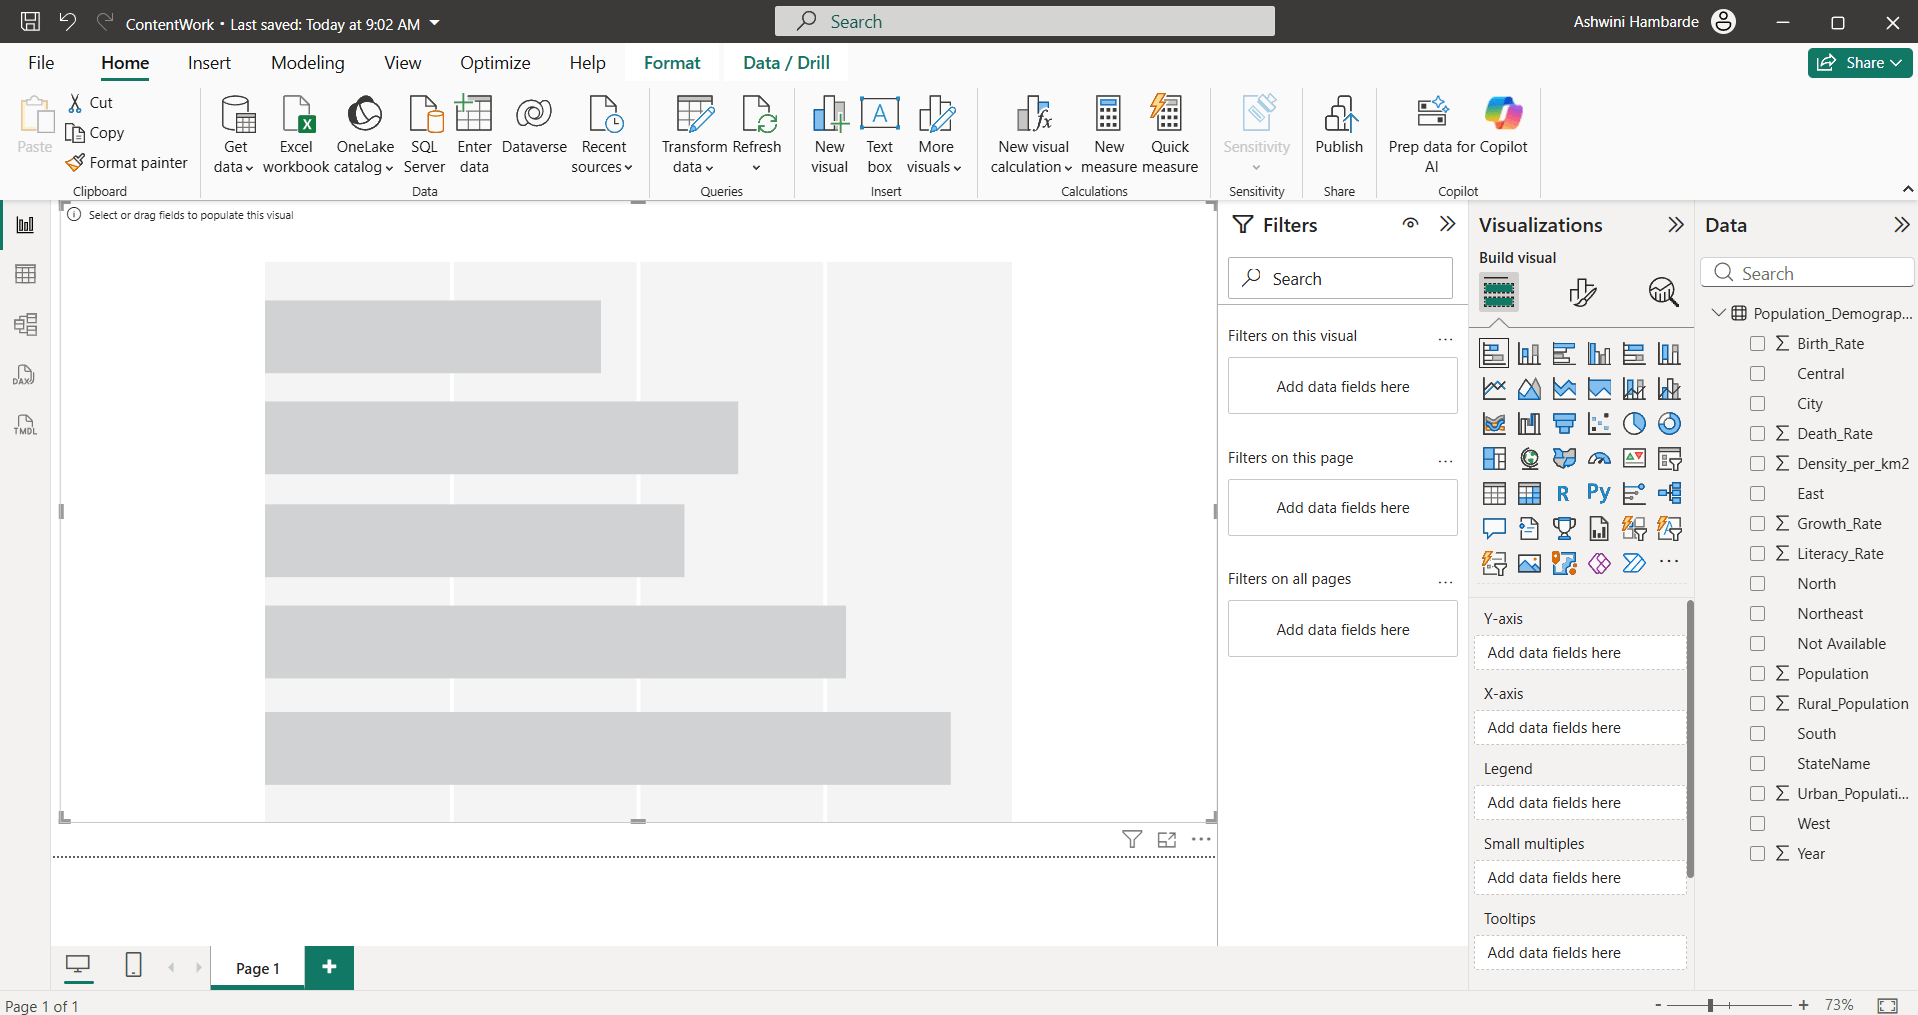
2
Drag column Region on Y axis and Population on X axis from data pane
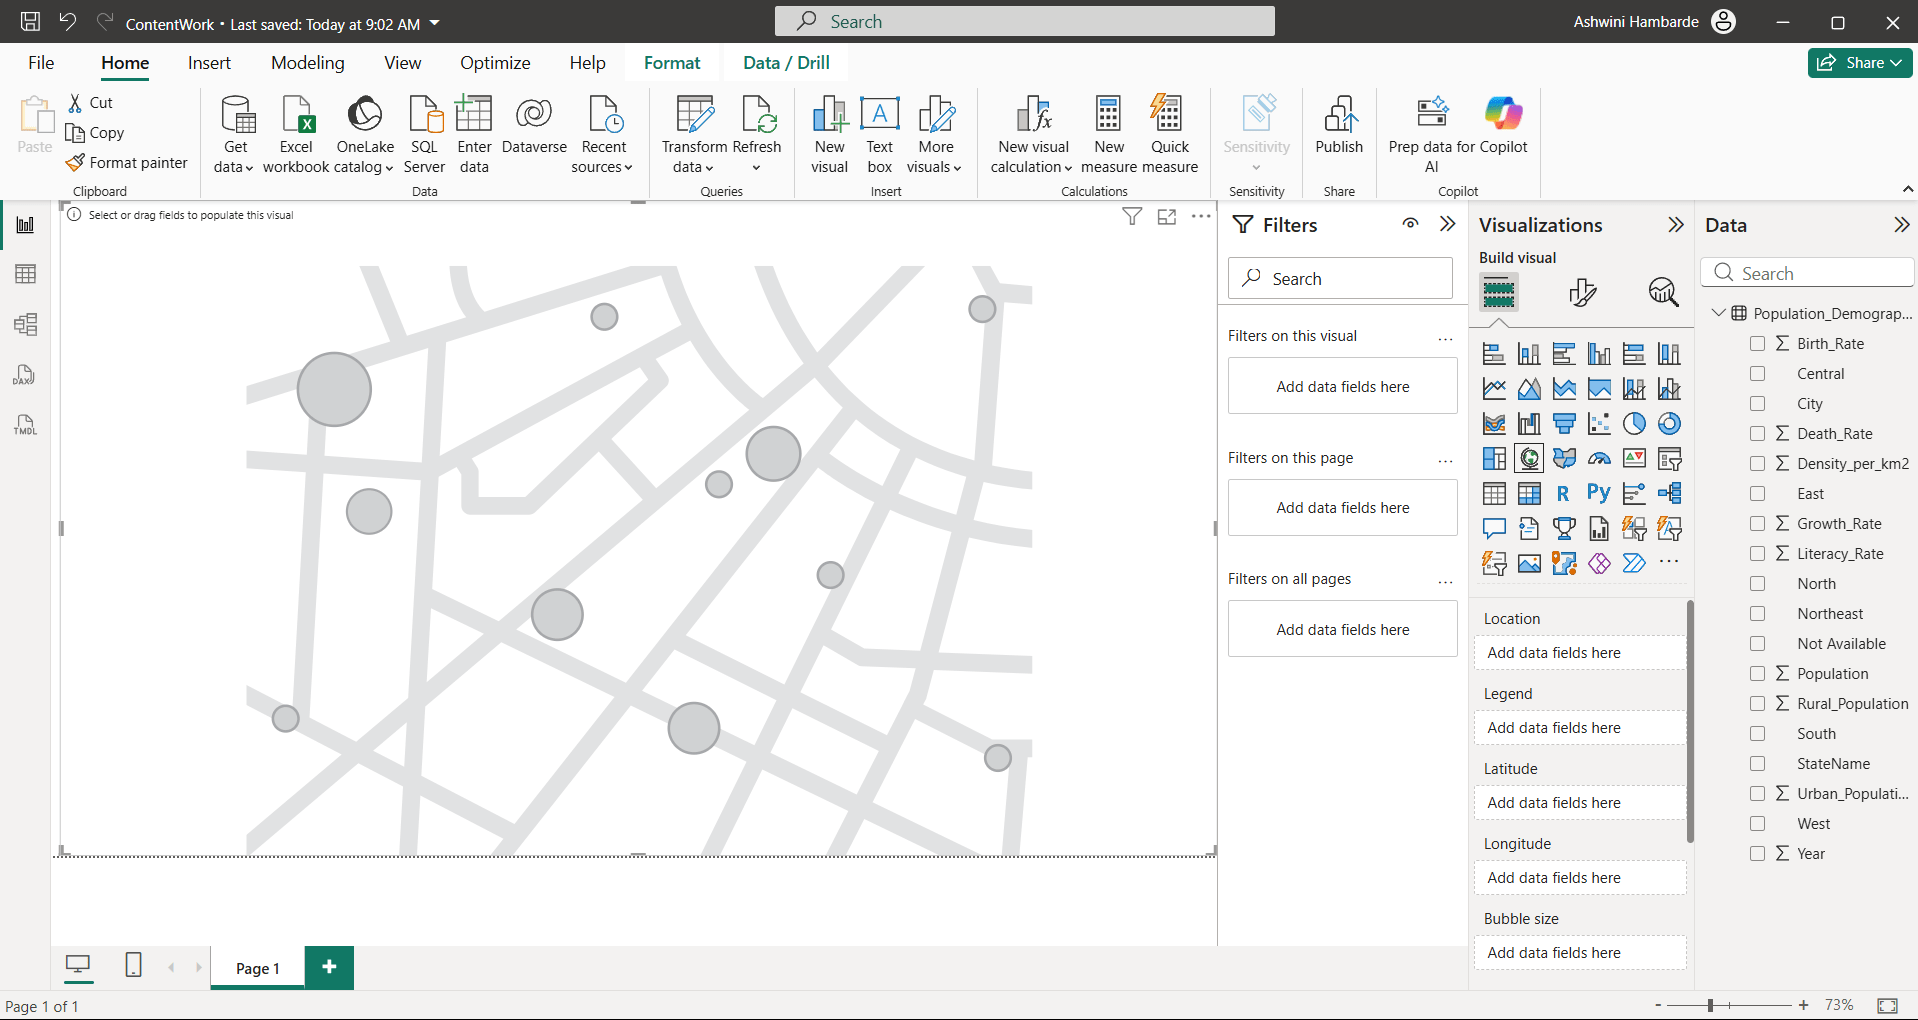
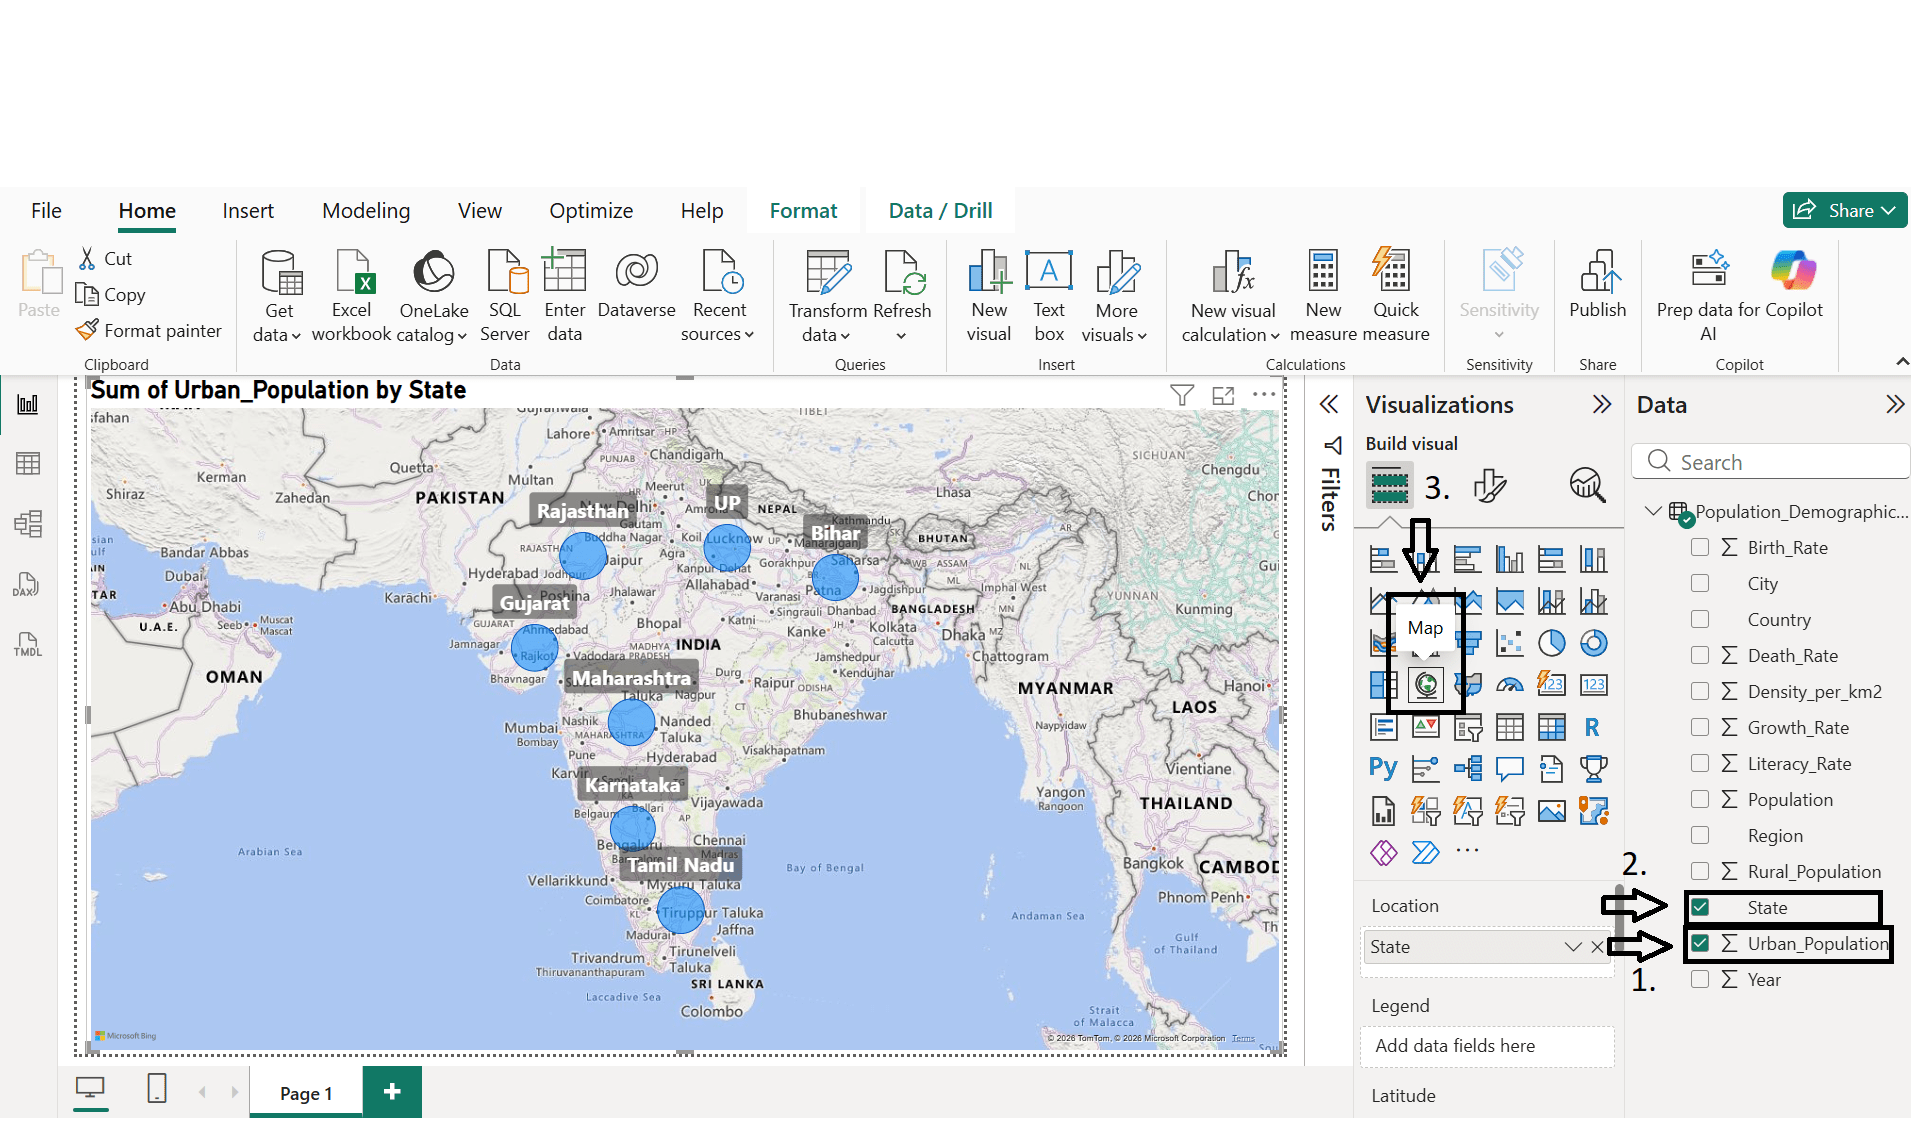
3
Drag Map visual template from visualization pane
4
Drag State column in location and urban_population in bubble size
Great job!
You have successfully completed the Power BI Desktop installation and setup lab from the Microsoft website, Explored Report View, Data View, and Model View, Imported CSV data using the “Get Data” option, Identified key insights and data distribution.
Checkpoint

Next-Lab Preparation
Git Push
git push origin branchNameTopic : Kickstarting Power BI Desktop
1) Power BI Setup
2) Power BI Interface Tour
3) Views in Power BI Desktop