Perform Hypothesis Testing for Decision Making

Business Scenario

Welcome!
Today is your 15th day as a Junior Data Analyst at a retail analytics company.
The retail company operates across multiple cities and sells products through different store types and sales channels. Management has noticed fluctuations in sales performance, customer satisfaction, and revenue across stores. Before introducing new pricing strategies and promotional campaigns, they want to determine whether the observed differences are genuine business patterns or simply due to random variations in the data.
Since making decisions based only on assumptions can lead to incorrect business strategies, management requires a data-driven approach that can validate findings and support confident decision-making.

Pre-Lab Preparation
Topic: Mastering Statistical Inference and Testing
1) Inferential Statistics: Beyond the Data
2) Decoding Hypothesis Testing: Methods and P-Values
3) Mastering the Central Limit Theorem
4) Population Parameters: Estimation Made Simple
5) P-Values and Errors: Navigating Statistical Uncertainty

Git Pull
Click here to download previous lab file: DM LAB 14
Click to download Dataset : Retail_Dataset_Cleaned
Task 1: Validating Business Assumptions Using Hypothesis Testing
git pull origin branchNameIn retail businesses, managers frequently observe differences in sales, customer ratings, and order values across stores and customer segments. However, they cannot make strategic decisions merely by observing these differences. They need evidence to determine whether the differences are significant enough to support business actions.
Therefore, analysts perform statistical testing to verify whether business assumptions are supported by data.
What is Hypothesis Testing?
Hypothesis Testing is a statistical technique used to determine whether the observed difference in sample data is significant enough to make conclusions about the population.
Key Terms
- Null Hypothesis (H₀): Assumes there is no significant difference.
- Alternative Hypothesis (H₁): Assumes there is a significant difference.


Open Google Colab
1
2
Import Required Libraries
import pandas as pd
import numpy as np
from scipy import stats
3
Upload the Retail Dataset
4
Load Dataset Using Pandas
df = pd.read_csv("/content/Retail_Dataset_Modified.csv")

print("Dataset Loaded Successfully")
Display First Five Records
5
df.head()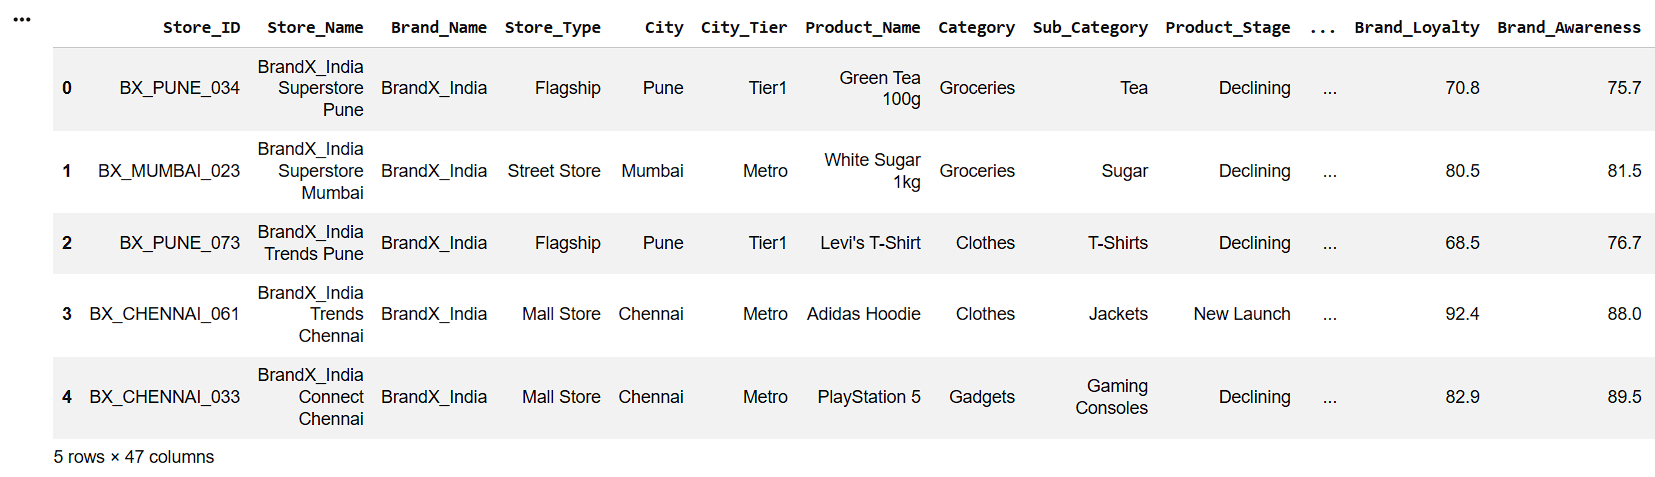
6
Check Dataset Information
df.info()7
Display Column Names
df.columns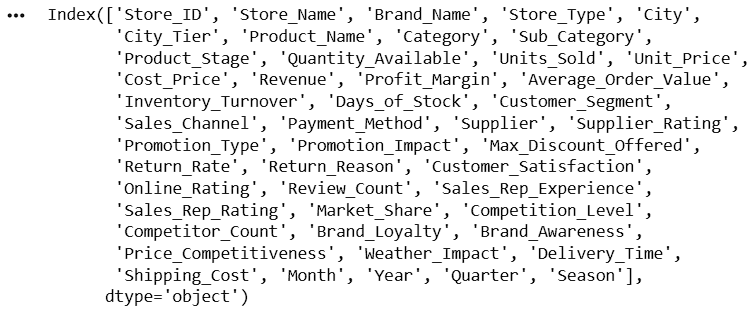
8
Compare Customer Satisfaction Between Two Store Types
Suppose management wants to know whether customer satisfaction differs between Flagship Stores and Mall Stores.
Define Hypotheses
- Null Hypothesis (H₀): Average customer satisfaction is the same for both store types.
- Alternative Hypothesis (H₁): Average customer satisfaction is different for both store types.
a
Extract Sample Data
flagship = df[df["Store_Type"]=="Flagship"]["Customer_Satisfaction"]

mall = df[df["Store_Type"]=="Mall Store"]["Customer_Satisfaction"]
b
Perform Independent T-Test
t_stat, p_value = stats.ttest_ind(
    flagship,
    mall,
    nan_policy="omit"
)

print("T Statistic:", t_stat)
print("P Value:", p_value)
An Independent T-Test checks whether the means of two independent groups are significantly different.

Interpret the Result
c
if p_value < 0.05:
    print("Reject Null Hypothesis")
else:
    print("Fail to Reject Null Hypothesis")
- If P-value < 0.05, reject the Null Hypothesis and conclude that customer satisfaction differs significantly between Flagship Stores and Mall Stores.
- If P-value ≥ 0.05, fail to reject the Null Hypothesis and conclude that there is insufficient evidence to say that the customer satisfaction differs between the two store types.
Task 2: Measuring Statistical Evidence Using P-Values
In retail businesses, managers often introduce promotional campaigns and discount strategies to improve customer experience.
After implementing these changes, they need to know whether the observed improvement is truly meaningful or simply occurred by chance.
To make reliable decisions, analysts measure the strength of statistical evidence using P-values.
What is a P-Value?
- A P-Value is the probability of obtaining the observed result assuming the Null Hypothesis is true.
Decision Rule
-
If P-value < 0.05, reject the Null Hypothesis.
-
If P-value ≥ 0.05, fail to reject the Null Hypothesis.
Why Do We Compare with 0.05?
In statistics, we usually use:
Significance Level (α) = 0.05

1
Check Whether Average Order Value Differs Across Customer Segments
df.groupby("Customer_Segment")[
    "Average_Order_Value"
].mean()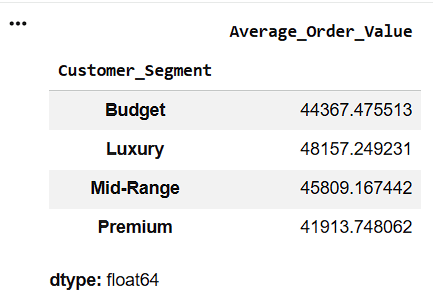
2
Compare Average Order Values of Premium and Budget Customers
premium = df[
    df["Customer_Segment"]=="Premium"
]["Average_Order_Value"]

budget = df[
    df["Customer_Segment"]=="Budget"
]["Average_Order_Value"]
3
Calculate Test Statistic and P-Value
t_stat, p_value = stats.ttest_ind(
    premium,
    budget,
    nan_policy="omit"
)

print("T Statistic:", t_stat)
print("P Value:", p_value)
4
Business Decision
if p_value < 0.05:
    print("Customer segments have significantly different order values.")
else:
    print("No significant difference found.")
Task 3: Understanding Sampling Behavior Using the Central Limit Theorem
Retail organizations often analyze only a sample of transactions instead of studying every transaction generated across stores. Management needs confidence that conclusions obtained from sample data accurately represent overall business performance.
Therefore, analysts use sampling principles to understand how sample statistics behave.
What is the Central Limit Theorem?
The Central Limit Theorem (CLT) states that when sufficiently large samples are repeatedly drawn from a population, the distribution of sample means becomes approximately normal, regardless of the population distribution.
1
Import Visualization Library
import matplotlib.pyplot as plt2
Generate Sample Means from Revenue
sample_means = []

for i in range(100):
    sample = df["Revenue"].sample(
        n=30,
        replace=True
    )

    sample_means.append(sample.mean())
3
Convert into DataFrame
sample_df = pd.DataFrame(
    {"Sample_Mean": sample_means}
)

sample_df.head()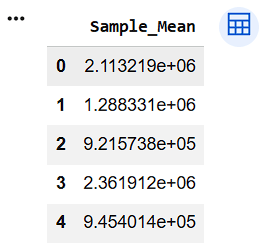
4
Plot Distribution of Sample Means
plt.figure(figsize=(8,5))

plt.hist(
    sample_df["Sample_Mean"],
    bins=15
)

plt.title(
    "Distribution of Revenue Sample Means"
)
plt.xlabel("Sample Mean Revenue")
plt.ylabel("Frequency")

plt.show()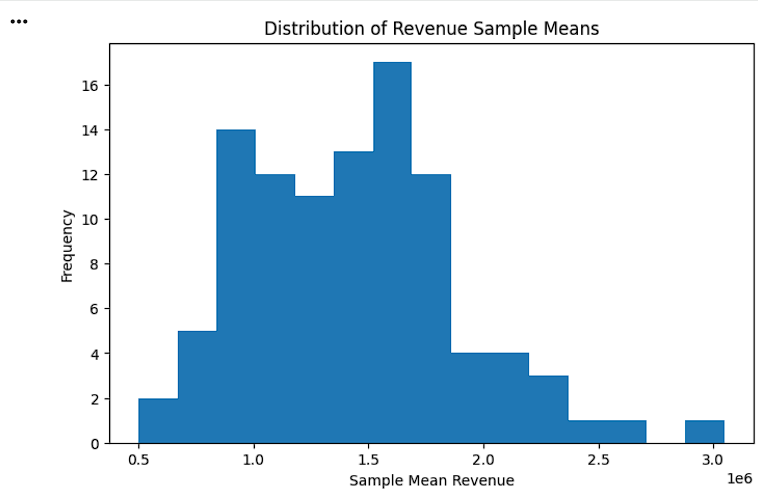
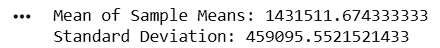
Calculate Mean and Standard Deviation
5
print(
    "Mean of Sample Means:",
    sample_df["Sample_Mean"].mean()
)
print(
    "Standard Deviation:",
    sample_df["Sample_Mean"].std()
)
Great job!
You have successfully completed your lab on Perform Hypothesis Testing for Decision Making. In this lab, you have: Applied hypothesis testing to validate business assumptions, Calculated and interpreted P-values, compared business metrics using statistical testing, understood how sample means behave using the Central Limit Theorem, Generated statistically supported insights for retail decision-making.
You are now ready to move to the next stage of Junior Data Analyst.
Checkpoint
Git Push
git push origin branchNameNext-Lab Preparation
Topic: Visualizing Data with Matplotlib - PS4 Sales Analysis
1) Discovering Matplotlib basics
2) Enhancing visuals with Matplotlib
Topic: Visualizing Data with Seaborn - Mumbai West House Pricing
1) Easing visuals with Seaborn
2) Customizing Seaborn Charts